Visualize Empirical Cumulative Distribution Function
This is a visualization method used to examine the distribution of object sizes. It is an alternative to histogram visualization.
plantcv.visualize.ecdf.obj_size(mask, title=None) returns fig_ecdf
- Parameters:
- mask - Binary mask made from selected contours (default mask=None).
- title - The title for the ecdf plot (default title=None)
Context:
- Examine the cumulative distribution of object sizes found in a binary mask. This can be used as an alternative
to histogram visualization.
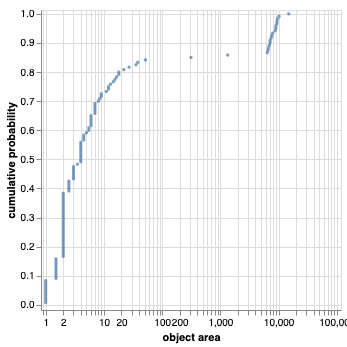
- The y-axis presents the cumulative probability (range: [0,1]).
- The x-axis presents the object area in common log-scale (logarithm with base 10)
- Example use:
- Below
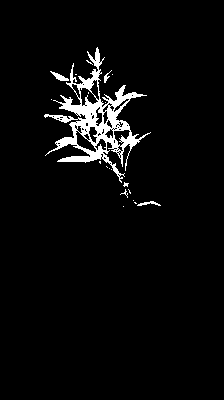
Binary mask
from plantcv import plantcv as pcv
pcv.params.debug = "plot"
fig_ecdf = pcv.visualize.ecdf.obj_size(mask=mask)
Cumulative distribution of object sizes
Source Code: Here