Analyze NIR intensity
This function calculates the intensity of each pixel associated with the plant and writes the values out to a file. Can also print out a histogram plot of pixel intensity and a pseudocolor image of the plant.
analyze_NIR_intensity(img, rgbimg, mask, bins, device, hisplot=False, debug=None, filename=False)
returns device, header of histogram, histogram values, pseudocolored image
- Parameters:
- img - Input image
- rgbimg - Input image with 3-dimensions (for pseudocolor)
- mask - Mask made from selected contours
- bins - Number of class to divide spectrum into
- device - Counter for image processing steps
- debug - None, "print", or "plot". Print = save to file, Plot = print to screen. Default = None
- filename - Name for output images
- Context:
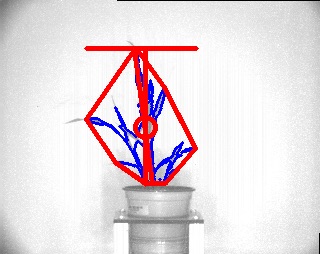
- Used to mask rectangluar regions of an image
- Example use:
Output Data Units:
- Bins - bin values based on number of bins set by user
- Signal Histogram - histogram of object pixel intensity values 0 (unsaturated) to 255 (saturated)
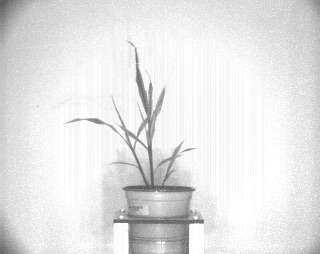
Original grayscale image
import plantcv as pcv

# Caclulates the proportion of pixels that fall into a signal bin and writes the values to a file. Also provides a histogram of this data and a pseudocolored image of the plant.
device, hist_header, hist_data, h_norm  = pcv.analyze_NIR_intensity(img, rgbimg, mask, 256, device, debug="print", filename="pseudocolored_plant")
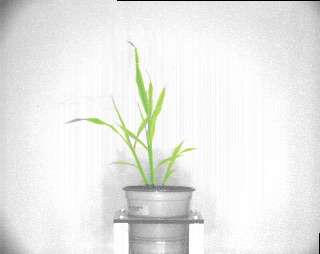
Pseudocolored NIR signal
NIR signal histogram
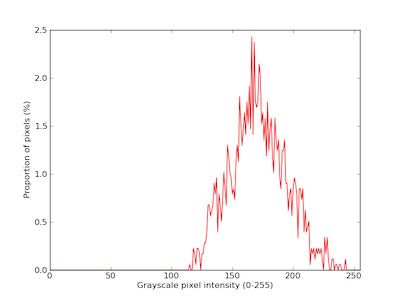
Image with shape characteristics