Analyze NIR intensity
This function calculates the intensity of each pixel associated with the plant and writes the values out to a file. Can also print out a histogram plot of pixel intensity and a pseudocolor image of the plant.
plantcv.analyze_nir_intensity(rgb_img, mask, bins, hisplot=False, filename=False)
returns header of histogram, histogram values, pseudocolored image
- Parameters:
- gray_img - 8- or 16-bit grayscale image data
- mask - Binary mask made from selected contours
- bins - Number of class to divide spectrum into
- filename - Name for output images
- Context:
- Used to mask rectangluar regions of an image
- Example use:
Output Data Units:
- Bins - bin values based on number of bins set by user
- Signal Histogram - histogram of object pixel intensity values 0 (unsaturated) to 255 (saturated)
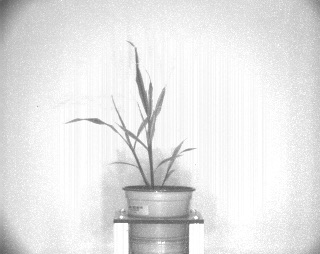
Original grayscale image
from plantcv import plantcv as pcv

# Set global debug behavior to None (default), "print" (to file), or "plot" (Jupyter Notebooks or X11)

pcv.params.debug = "print"

# Caclulates the proportion of pixels that fall into a signal bin and writes the values to a file. Also provides a histogram of this data and a pseudocolored image of the plant.
hist_header, hist_data, h_norm  = pcv.analyze_nir_intensity(gray_img, mask, 256, filename="pseudocolored_plant")
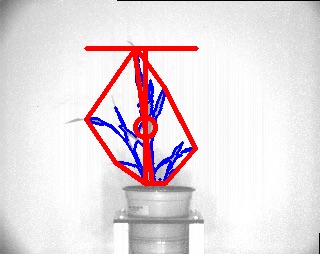
Pseudocolored NIR signal
NIR signal histogram
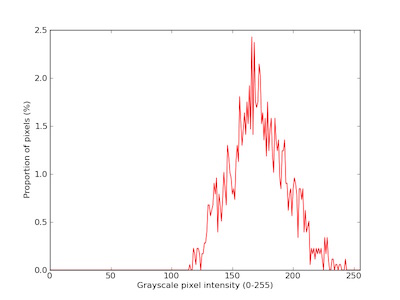
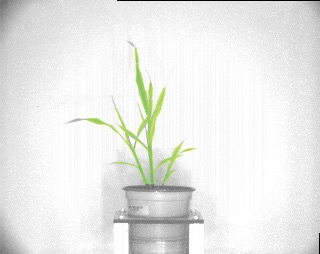
Image with shape characteristics