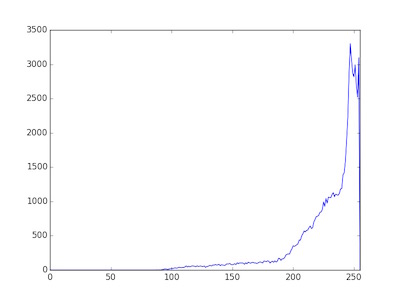
Plot Histogram
This is a plotting method used to examine the distribution of signal within an image.
plantcv.plot_hist(img, 'hist_name')
returns bins,hist, hist plot
- Parameters:
- img = the original image for analysis.
- name = the name of the output plot
- Context:
- Examine the distribution of the signal, this help you select a value for binary thresholding.
- Example use:
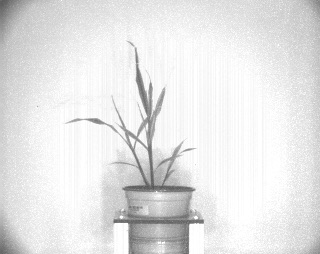
Grayscale image
from plantcv import plantcv as pcv

# Examine signal distribution within an image
# prints out an image histogram of signal within image
bins,hist=pcv.plot_hist(img, 'histogram')
Histogram of signal intensity