Boundary Line Tool
Set boundary line with boundary tool, this allows the user to find the extent-y ('height') above and below as well as the area above and below the boundary line. This tool functions best if the pot size/position of the plant remains relatively constant.
NOTE: This function will be depricated in the near future, please use the analyze_bound_horizontal function as an equivalent replacement. The analyze_bound function will continue to be functional and is now a wrapper for the analyze_bound_horizontal function.
analyze_bound(img, imgname, obj, mask, line_position, device , debug=None, filename=False)
returns device, boundary headers, boundary data, image with boundary data
- Parameters:
- img - image object (most likely the original), color(RGB)
- imgname - name of image
- obj - single or grouped contour object
- mask - binary mask of selected contours
- line_position = position of boundary line (a value of 0 would draw the line through the bottom of the image)
- device - Counter for image processing steps
- debug - None, "print", or "plot". Print = save to file, Plot = print to screen. Default = None
- filename - False or image name. If defined print image
- Context:
- Used to define a boundary line for the image, to find the height above and below as well as area above and below a boundary line.
- Could also be used as a method of flagging images about to go out-of-bounds (this QC tool will be added later)
- Example use:
Output Data Units:
- Y-Position - Height of the bound line used for measurement (height from bottom of image), pixels (units)
- Height-Above-Bound - Extent-y of object above bound line, pixels (units)
- Height-Below-Bound - Extent-y of object below bound line, pixels (units)
- Area-Above-Bound - area of object above bound line, pixels (units)
- Area-Below-Bound - area of object below bound line, pixels (units)
- Percent-Above-Bound - percentage of total area above the bound line
- Percent-Below-Bound - percentage of total area below the bound line
from plantcv import plantcv as pcv

# Set Boundary Line
device, boundary_header, boundary_data, boundary_img1 = pcv.analyze_bound(img, imgname, obj, mask, 950, device, debug='print', 'setaria_boundary_img.png')
Boundary tool output image (y = 950)
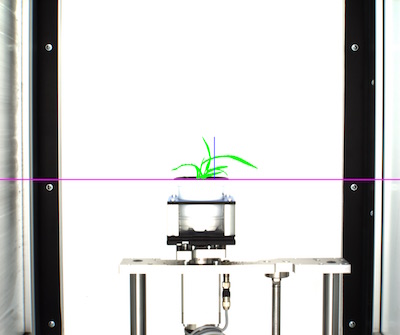
Boundary line set at 950, purple line is boundary line, blue line is extent y above boundary line, green is area above boundary line.
Boundary tool output image (y = 330)
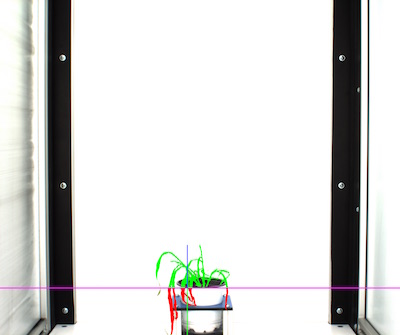
Boundary line set at 330, purple is boundary line, blue line is extent y above boundary line, green line is extent y below boundary line, green is area above boundary line and red is area below boundary line.