Analyze Color
Extract color data of objects and produce pseudocolored images, can extract data for RGB (Red, Green, Blue), HSV (Hue, Saturation, Value) and LAB (Lightness, Green-Magenta, Blue Yellow) channels.
analyze_color(img, imgname, mask, bins, device, debug=None, hist_plot_type =None, pseudo_channel='v', pseudo_bkg='img', resolution=300, filename=False)
returns device, color channel histogram headers, color channel histogram data, analysis images
- Parameters:
- img - image object (most likely the original), color(RGB)
- imgname - name of image
- mask - binary mask of selected contours
- bins - number of color bins (0-256), if you would like to bin data, you would alter this number
- device - Counter for image processing steps
- debug - None, "print", or "plot". Print = save to file, Plot = print to screen. Default = None
- hist_plot_type - 'None', 'all', 'rgb','lab' or 'hsv', this is the data to be printed to an SVG histogram file, however all (every channel) data is still stored to the database.
- pseudo_channel - 'None', 'r'(red), 'g'(green), 'b'(blue), 'l' (lightness), 'm' (green-magenta), 'y' (blue-yellow), 'h'(hue),'s'(saturation), or 'v'(value), creates pseduocolored image based on the specified channel.
- pseudo_bkg = 'img' => channel image, 'white' => white background image, 'both' => both img and white options
- resolution= resolution of output images
- filename - False or image name. If defined print image
- Context:
- Used to extract color data from RGB, LAB, and HSV color channels.
- Generates histogram of color channel data.
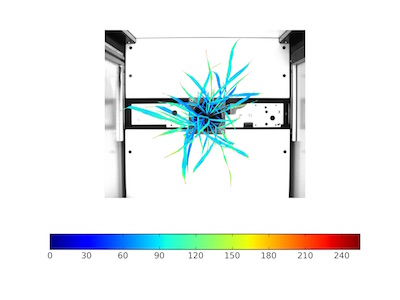
- Generaes pseudocolored output image of one of the channels specified.
- Example use:
-
Output Data Units:
- Red Channel - histogram of object pixel intensity values 0 (unsaturated) to 255 (saturated)
- Green Channel - histogram of object pixel intensity values 0 (unsaturated) to 255 (saturated)
- Blue Channel - histogram of object pixel intensity values 0 (unsaturated) to 255 (saturated)
- Hue Channel - histogram of object pixel intensity values 0 (unsaturated) to 255 (saturated)
- Saturation Channel - histogram of object pixel intensity values 0 (unsaturated) to 255 (saturated)
- Value Channel - histogram of object pixel intensity values 0 (unsaturated) to 255 (saturated)
- Lightness Channel - histogram of object pixel intensity values 0 (unsaturated) to 255 (saturated)
- Green-Magenta Channel - histogram of object pixel intensity values 0 (unsaturated) to 255 (saturated)
- Blue-Yellow Channel - histogram of object pixel intensity values 0 (unsaturated) to 255 (saturated)
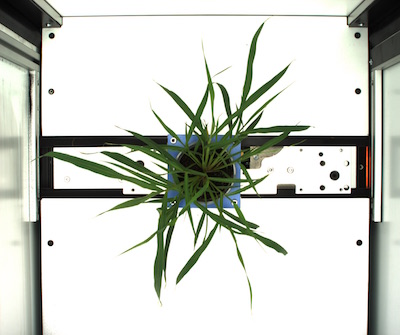
Original image
from plantcv import plantcv as pcv

# Analyze Color

device, color_header, color_data, analysis_images= pcv.analyze_color(img, imagename, mask, 256, device, debug="print", None, 'v', 'img', 300, /home/user/analyze_color.png)
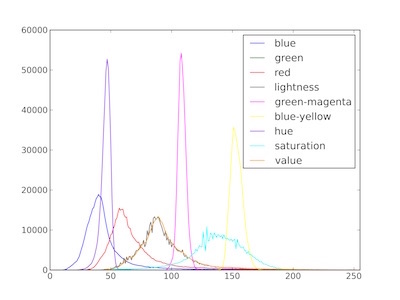
Histograms of (R, G, B), (H, S, V), and (L, A, B) color channels
Pseudocolored value-channel image