Analyze FLU Signal
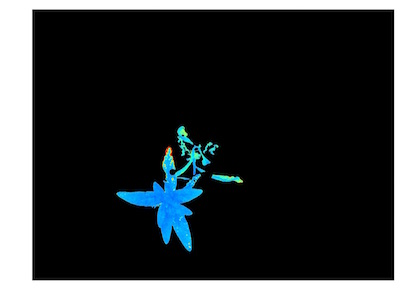
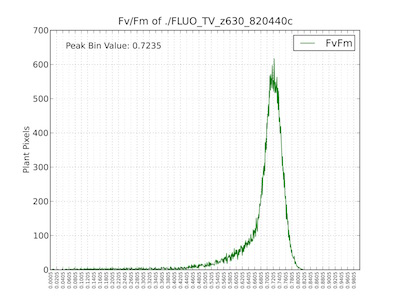
Extract Fv/Fm data of objects and produce pseudocolored images.
plantcv.fluor_fvfm(fdark, fmin, fmax, mask, filename, bins=1000)
returns FLU channel histogram headers, FLU channel histogram data
- Parameters:
- fdark - image object, grayscale
- fmin - image object grayscale
- fmax - image object, grayscale
- mask - binary mask of selected contours
- filename - False or image name. If defined print image
- bins - number of grayscale bins (0-256 for 8-bit images and 0 to 65,536), if you would like to bin data, you would alter this number
- Context:
- Used to extract fv/fm per identified plant pixel.
- Generates histogram of fv/fm data.
- Generaes pseudocolored output image with fv/fm values per plant pixel.
- Example use:
Output Data Units:
- Bin-number - number of bins set by user
- FV/FM Bins - bin values based on number of bins set by user
- FV/FM Histogram - histogram of FV/FM ratio values for object
- FV/FM Histogram Peak - bin value of histogram peak (greatest number of pixels)
- FV/FM Median - bin value of histogram median
- F-Dark Passed QC - Check (True or False) to determine if Fdark image does not have pixel intensity values above 2000.
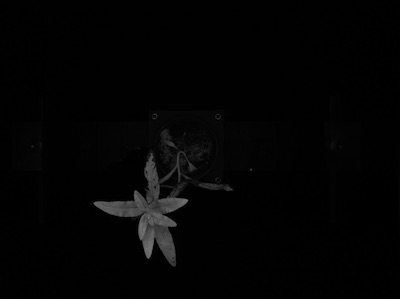
Fdark image

Fmin image

Fmax image
from plantcv import plantcv as pcv

# Set global debug behavior to None (default), "print" (to file), or "plot" (Jupyter Notebooks or X11)
pcv.params.debug = "print"

# Analyze Fv/Fm
 fvfm_header, fvfm_data = pcv.fluor_fvfm(fdark, fmin, fmax, kept_mask, filename, 1000)
Histogram of Fv/Fm values
Pseudocolored output image based on Fv/Fm values