Analyze Color
Extract color data of objects and produce pseudocolored images, can extract data for RGB (Red, Green, Blue), HSV (Hue, Saturation, Value) and LAB (Lightness, Green-Magenta, Blue Yellow) channels.
plantcv.analyze_color(rgb_img, mask, bins, hist_plot_type=None)
returns color channel histogram headers, color channel histogram data, analysis images
- Parameters:
- rgb_img - RGB image data
- mask - binary mask of selected contours
- bins - number of color bins (0-256), if you would like to bin data, you would alter this number
- hist_plot_type - None (default), 'all', 'rgb','lab' or 'hsv', this is the data to be printed to an SVG histogram file, however all (every channel) data is still stored to the database.
- Context:
- Used to extract color data from RGB, LAB, and HSV color channels.
- Generates histogram of color channel data.
-
Example use:
-
Output Data Units:
- Red Channel - histogram of object pixel intensity values 0 (unsaturated) to 255 (saturated)
- Green Channel - histogram of object pixel intensity values 0 (unsaturated) to 255 (saturated)
- Blue Channel - histogram of object pixel intensity values 0 (unsaturated) to 255 (saturated)
- Hue Channel - histogram of object pixel intensity values 0 (unsaturated) to 255 (saturated)
- Saturation Channel - histogram of object pixel intensity values 0 (unsaturated) to 255 (saturated)
- Value Channel - histogram of object pixel intensity values 0 (unsaturated) to 255 (saturated)
- Lightness Channel - histogram of object pixel intensity values 0 (unsaturated) to 255 (saturated)
- Green-Magenta Channel - histogram of object pixel intensity values 0 (unsaturated) to 255 (saturated)
- Blue-Yellow Channel - histogram of object pixel intensity values 0 (unsaturated) to 255 (saturated)
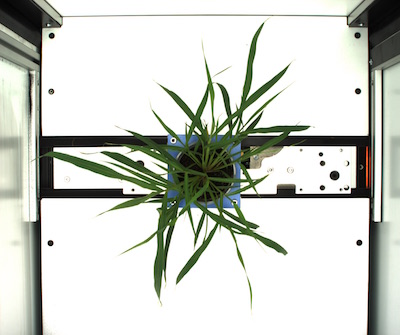
Original image
from plantcv import plantcv as pcv

# Set global debug behavior to None (default), "print" (to file), or "plot" (Jupyter Notebooks or X11)

pcv.params.debug = "print"

# Analyze Color

color_header, color_data, analysis_image = pcv.analyze_color(rgb_img, mask, 256, 'all')
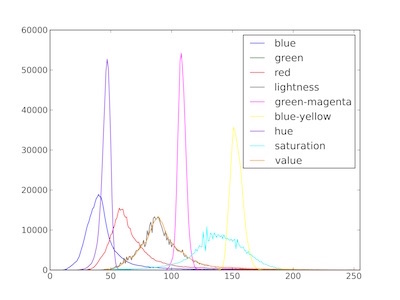
Histograms of (R, G, B), (H, S, V), and (L, A, B) color channels
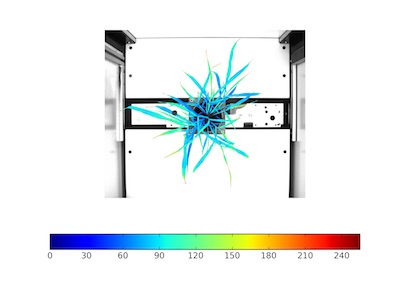
Pseudocolored value-channel image