Plot Histogram
This is a plotting method used to examine the distribution of signal within an image.
plantcv.plot_hist(gray_img, mask=None, bins=256)
returns bins, hist
- Parameters:
- gray_img - Grayscale image data, the original image for analysis.
- mask - Optional binary mask made from selected contours (default mask=None)
- bins - Number of class to divide spectrum into
- Context:
- Examine the distribution of the signal, this helps you select a value for binary thresholding.
- Example use:
Grayscale image

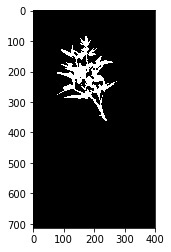
Mask
from plantcv import plantcv as pcv

# Examine signal distribution within an image
# prints out an image histogram of signal within image
header, hist_data, hist_figure = pcv.plot_hist(gray_img, mask=mask, bins=256)
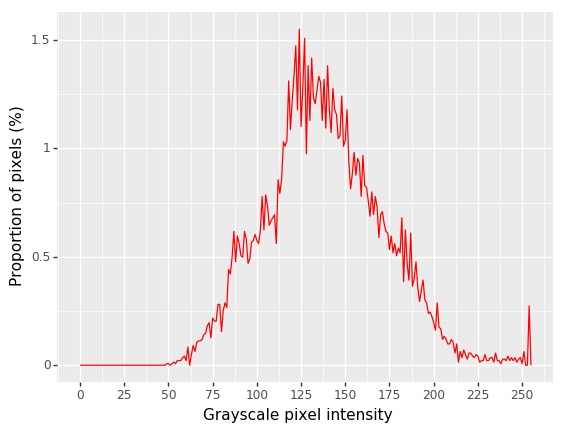
Histogram of signal intensity