Analyze NIR Intensity
This function calculates the intensity of each pixel associated with the plant and writes the values out to a file. Can also print out a histogram plot of pixel intensity.
plantcv.analyze_nir_intensity(gray_img, mask, bins=256, histplot=False)
returns analysis_images
- Parameters:
- gray_img - 8- or 16-bit grayscale image data
- mask - Binary mask made from selected contours
- bins - Number of class to divide spectrum into (default bins = 256)
- histplot - If True plots histogram of intensity values (default histplot = False)
- Context:
- Used to mask rectangular regions of an image
- Data automatically gets stored into the Outputs class. Users can look at the data collected at any point during the workflow by using pcv.print_results which prints all stored data to a .json file.
- Example use:
- Output data stored: Summary of Output Observations
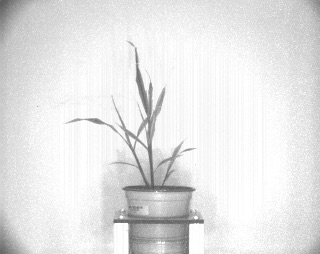
Original grayscale image
from plantcv import plantcv as pcv

# Set global debug behavior to None (default), "print" (to file),
# or "plot" (Jupyter Notebooks or X11)

pcv.params.debug = "print"

# Caclulates the proportion of pixels that fall into a signal bin and writes the values to a file. Also provides a histogram of this data
analysis_images  = pcv.analyze_nir_intensity(gray_img, mask, 256, histplot=True)
NIR signal histogram
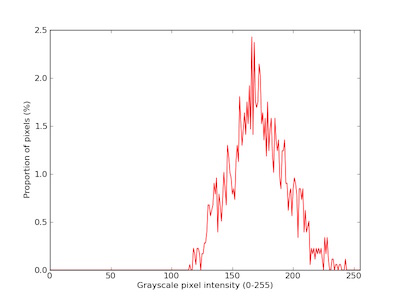
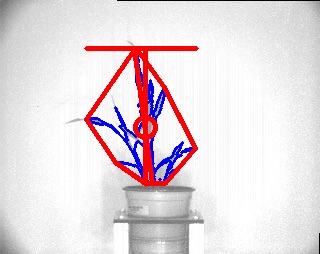
Image with shape characteristics
Note: The grayscale input image and object mask can be used with the pcv.visualize.pseudocolor function which allows the user to pick a colormap for plotting.