Horizontal Boundary Line Tool
Set boundary line with boundary tool, this allows the user to find the extent-y ('height') above and below as well as the area above and below the boundary line. This tool functions best if the pot size/position of the plant remains relatively constant.
plantcv.analyze_bound_horizontal(img, obj, mask, line_position)
returns images with boundary data
- Parameters:
- img - RGB or grayscale image data for plotting
- obj - single or grouped contour object
- mask - binary mask of selected contours
- line_position = position of boundary line (a value of 0 would draw the line through the top of the image)
- Context:
- Used to define a boundary line for the image, to find the height above and below as well as area above and below a boundary line.
- Data automatically gets stored into the Outputs class. Users can look at the data collected at any point during the workflow by using pcv.print_results which prints all stored data to a .json file.
- Example use:
- Output data stored: Summary of Output Observations
from plantcv import plantcv as pcv

# Set global debug behavior to None (default), "print" (to file),
# or "plot" (Jupyter Notebooks or X11)
pcv.params.debug = "print"

# Set Boundary Line
boundary_images = pcv.analyze_bound_horizontal(img, obj, mask, 300)
Boundary tool output image (y = 300)
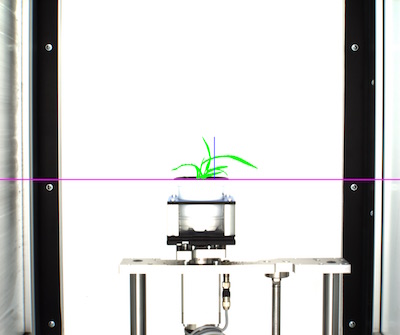
Boundary line set at 300, purple line is boundary line, blue line is extent y above boundary line, green is area above boundary line.
Boundary tool output image (y = 520)
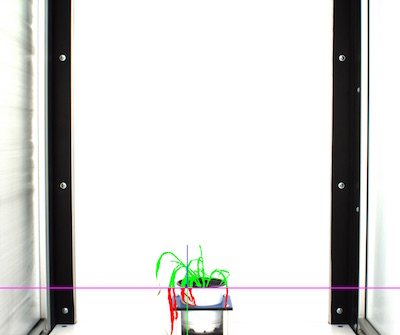
Boundary line set at 520, purple is boundary line, blue line is extent y above boundary line, green line is extent y below boundary line, green is area above boundary line and red is area below boundary line.