Cluster Contours
This function take a image with multiple contours and clusters them based on user input of rows and columns
platncv.cluster_contours(img, roi_objects, roi_obj_hierarchy, nrow=1,ncol=1, show_grid=False)
returns grouped_contour_indexes, contours, hierarchy
- Parameters:
- img - RGB or grayscale image data for plotting
- roi_objects - object contours in an image that are needed to be clustered.
- roi_obj_hierarchy - object hierarchy
- nrow - approximate number of rows (default nrow=1)
- ncol - approximate number of columns (default ncol=1)
- show_grid - if True then a grid gets displayed in debug mode (default show_grid=False)
- Context:
- Cluster contours based on number of approximate rows and columns
- Example use:
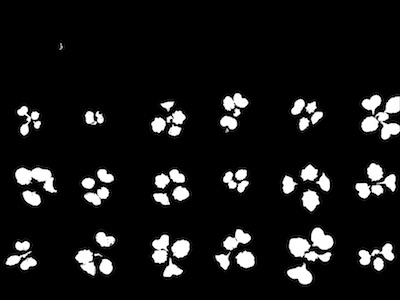
ROI Objects Output
from plantcv import plantcv as pcv
# Set global debug behavior to None (default), "print" (to file),
# or "plot" (Jupyter Notebooks or X11)
pcv.params.debug = "print"
# clusters them based on user input of rows and columns
clusters_i, contours, hierarchy = pcv.cluster_contours(img, roi_objects,
roi_obj_hierarchy, 4, 6)
clusters_i, contours, hierarchy = pcv.cluster_contours(img, roi_objects,
roi_obj_hierarchy,
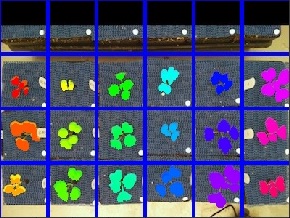
4, 6, show_grid=True)
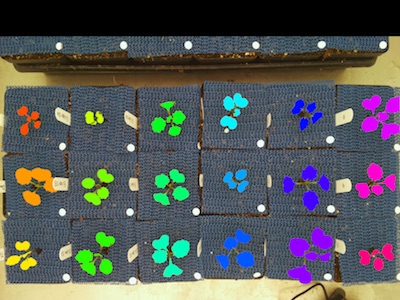
Cluster Contour Image
Cluster Contour Image with Grid