Analyze Color
Extract color data of objects and produce pseudocolored images, can extract data for RGB (Red, Green, Blue), HSV (Hue, Saturation, Value) and LAB (Lightness, Green-Magenta, Blue Yellow) channels.
plantcv.analyze_color(rgb_img, mask, hist_plot_type=None)
returns Histogram image (if hist_plot_type is not None, otherwise returns None object)
- Parameters:
- rgb_img - RGB image data
- mask - binary mask of selected contours
- hist_plot_type - None (default), 'all', 'rgb','lab' or 'hsv', this is the data to be printed to an SVG histogram file, however all (every channel) data is still stored to the database.
- Context:
- Used to extract color data from RGB, LAB, and HSV color channels.
- Generates histogram of color channel data.
- Example use:
- Output data stored: Data ('blue_frequencies', 'green_frequencies', 'red_frequencies', 'lightness_frequencies', 'green-magenta_frequencies',
'blue-yellow_frequencies', 'hue_frequencies', 'saturation_frequencies', 'value_frequencies', 'hue_circular_mean', 'hue_circular_std', 'hue_median')
automatically gets stored to the
Outputsclass when this function is ran. These data can always get accessed during a workflow (example below). For more detail about data output see Summary of Output Observations
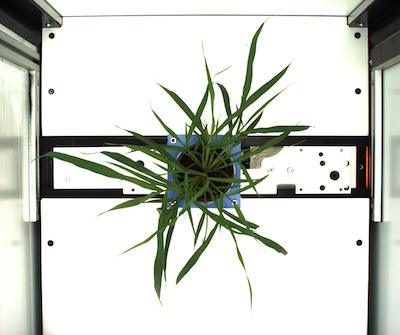
Original image
from plantcv import plantcv as pcv

# Set global debug behavior to None (default), "print" (to file),
# or "plot" (Jupyter Notebooks or X11)

pcv.params.debug = "print"

# Analyze Color

analysis_image = pcv.analyze_color(rgb_img, mask, 'all')

# Access data stored out from analyze_color
hue_circular_mean = pcv.outputs.observations['hue_circular_mean']['value']
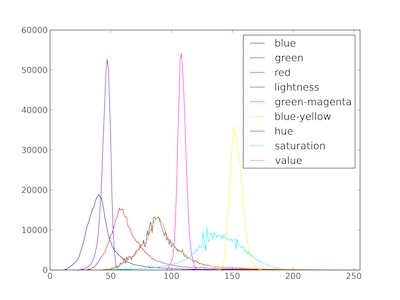
Histograms of (R, G, B), (H, S, V), and (L, A, B) color channels
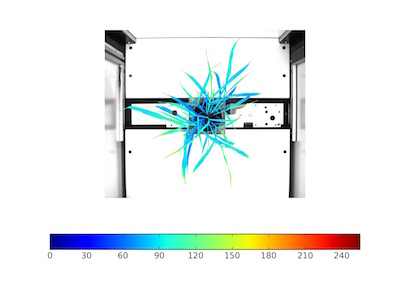
Pseudocolored value-channel image
Note: The grayscale input image (e.g. value-channel) and object mask can be used with the pcv.visualize.pseudocolor function which allows the user to pick a colormap for plotting.