Analyze Shape Characteristics of Object
Shape analysis outputs numeric properties for an input object (contour or grouped contours), works best on grouped contours.
plantcv.analyze_object(img, obj, mask)
returns analysis_image
- Parameters:
- img - RGB or grayscale image data for plotting.
- obj - Single or grouped contour object.
- mask - Binary image to use as mask for moments analysis.
- Context:
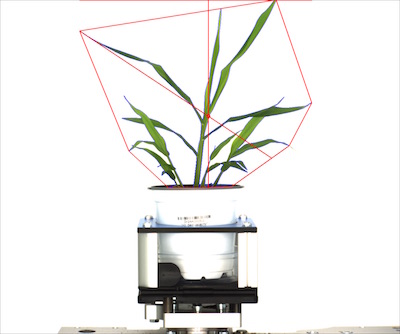
- Used to output shape characteristics of an image, including height, object area, convex hull, convex hull area, perimeter, extent x, extent y, longest axis, centroid x coordinate, centroid y coordinate, in bounds QC (if object touches edge of image, image is flagged).
- Example use:
- Output data stored: Data ('area', 'convex_hull_area', 'solidity', 'perimeter', 'width', 'height', 'longest_path', 'center_of_mass,
'convex_hull_vertices', 'object_in_frame', 'ellipse_center', 'ellipse_major_axis', 'ellipse_minor_axis', 'ellipse_angle', 'ellipse_eccentricity')
automatically gets stored to the
Outputsclass when this function is ran. These data can always get accessed during a workflow (example below). For more detail about data output see Summary of Output Observations
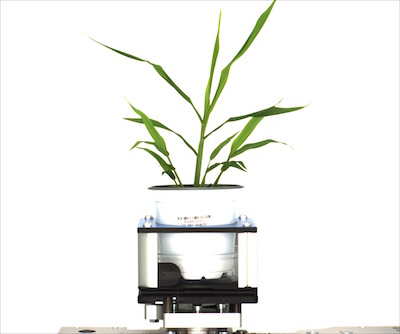
Original image

from plantcv import plantcv as pcv

# Set global debug behavior to None (default), "print" (to file),
# or "plot" (Jupyter Notebooks or X11)

pcv.params.debug = "print"

# Characterize object shapes

shape_image = pcv.analyze_object(img, objects, mask)

# Save returned images with more specific naming
pcv.print_image(shape_image, '/home/malia/setaria_shape_img.png')

# Access data stored out from analyze_object
plant_solidity = pcv.outputs.observations['solidity']['value']
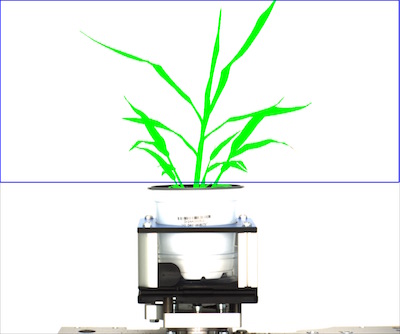
Image with identified objects

Image with shape characteristics

Source Code: Here