Analyze a Hyperspectral Index
This function calculates the hyperspectral index statistics and writes the values as observations out to the Outputs class.
plantcv.hyperspectral.analyze_index(index_array, mask, bins=100, min_bin=0, max_bin=1)
returns None
-
Parameters:
- index_array - instance of the
Spectral_dataclass (created by running pcv.hyperspectral.extract_index) - mask - Binary mask made from selected contours
- histplot - If True plots histogram of intensity values
- bins - Optional, number of classes to divide spectrum into (default bins=100)
- min_bin - Optional, minimum bin label. Default of 0 will be used for the smallest bin label while calculating pixel frequency data unless otherwise defined.
min_bin="auto"will set minimum bin to the smallest observed pixel value within the masked index provided. - max_bin - Optional, maximum bin label. Default of 1 will be used for the maximum bin label unless otherwise defined.
max_bin="auto"will set maximum bin to the largest observed pixel value within the masked index provided.
- index_array - instance of the
-
Context:
- Calculates data about mean, median, and standard deviation of an input index within a masked region.
- If using an index that is expected to have negative values after masking (i.e. PRI) the default
min_bin=0will cut off pixel frequency data at 0 unless adjusted.
- Example use:
- Below
- Output data stored: Mean, median, and standard deviation of the index automatically gets stored to the
Outputsclass when this function is ran. These data can always get accessed during a workflow (example below). For more detail about data output see Summary of Output Observations
from plantcv import plantcv as pcv

pcv.hyperspectral.analyze_index(index_array=ndvi_index, mask=leaf_mask, histplot=True, bins=100, min_bin=0, max_bin="auto")
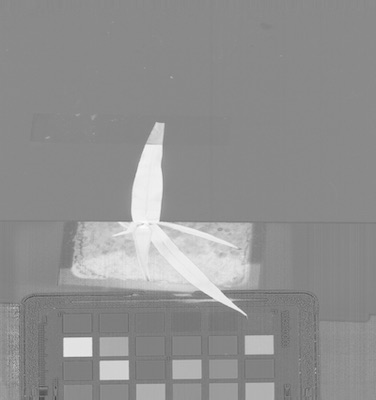
NDVI Index Image
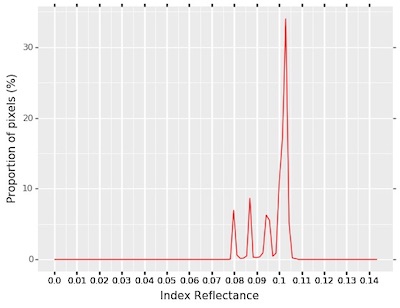
Masked Index Histogram
Source Code: Here