Analyze Color
Extract color data of objects and produce a histogram. Data can be extracted for RGB (Red, Green, Blue), HSV (Hue, Saturation, Value) and LAB (Lightness, Green-Magenta, Blue Yellow) channels.
plantcv.analyze.color(rgb_img, labeled_mask, n_labels=1, colorspaces="hsv", label=None)
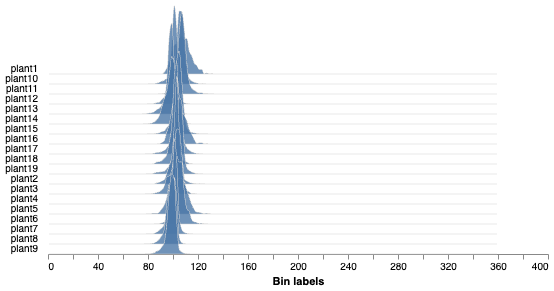
returns Ridgeline plot of histograms of hue values
- Parameters:
- rgb_img - RGB image data
- labeled_mask - Labeled mask of objects (32-bit, output from
pcv.create_labelsorpcv.roi.filter). - n_labels - Total number expected individual objects (default = 1).
- colorspaces - 'all', 'rgb', 'lab', or 'hsv'. This can limit the data saved out (default = 'hsv').
- label - Optional label parameter, modifies the variable name of observations recorded. Can be a prefix or list (default = pcv.params.sample_label).
- Context:
- Used to extract color data from RGB, LAB, and HSV color channels.
- Generates histogram of color channel data.
- Example use:
- Output data stored: Data ('blue_frequencies', 'green_frequencies', 'red_frequencies', 'lightness_frequencies', 'green-magenta_frequencies',
'blue-yellow_frequencies', 'hue_frequencies', 'saturation_frequencies', 'value_frequencies', 'hue_circular_mean', 'hue_circular_std', 'hue_median')
automatically gets stored to the
Outputsclass when this function is ran. These data can always get accessed during a workflow (example below). For more detail about data output see Summary of Output Observations
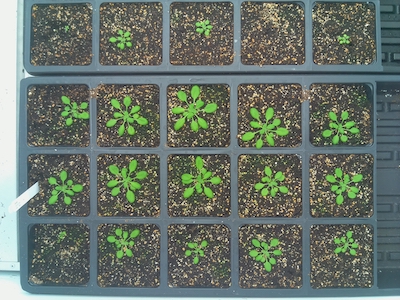
Original image
from plantcv import plantcv as pcv

# Set global debug behavior to None (default), "print" (to file),
# or "plot" (Jupyter Notebooks or X11)

pcv.params.debug = "plot"
# Optionally, set a sample label name
pcv.params.sample_label = "plant"

# Analyze Color
analysis_image = pcv.analyze.color(rgb_img=rgb_img, labeled_mask=mask, n_labels=1, colorspaces='hsv')

# Access data stored out from analyze_color
hue_circular_mean = pcv.outputs.observations['plant_1']['hue_circular_mean']['value']
Histograms of hue values
Source Code: Here