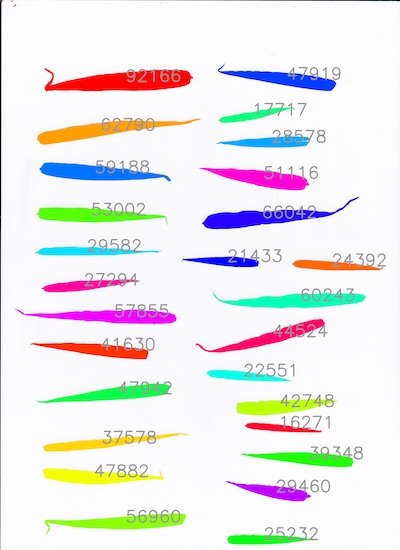
Visualize object sizes
This function plots separate objects as different colors and annotates the largest objects with their respective sizes.
plantcv.visualize.obj_sizes(img, mask, num_objects=100)
returns plotting_img
-
Parameters:
- img - RGB or grayscale image data for plotting annotations.
- mask - Binary mask made from selected contours.
- num_objects - Optional parameter to limit the number of objects that will get annotated, default
num_objects=100).
-
Context:
- Used to annotate object sizes in a binary mask. This visualization aims to streamline the workflow building process,
especially while deciding the
sizethreshold for a fill step.
- Used to annotate object sizes in a binary mask. This visualization aims to streamline the workflow building process,
especially while deciding the
- Example use:
- Below
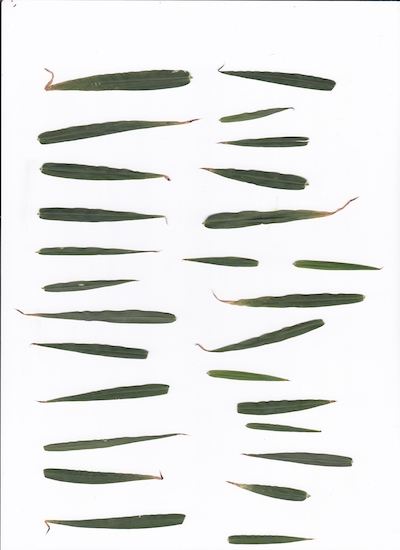
Original image:
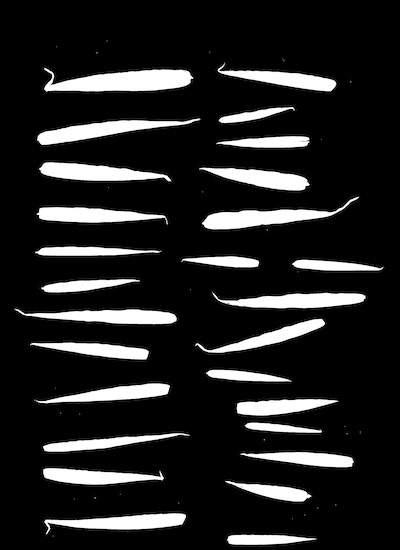
Binary mask:
from plantcv import plantcv as pcv

pcv.params.debug='plot'

plotting_img = pcv.visualize.obj_sizes(img=rgb_img, mask=mask, num_objects=27)
Output Visualization
Source Code: Here