Analyze Spectral Reflectance
This function analyzes the reflectance values across the wavelengths measured by the input multi/hyperspectral datacube.
plantcv.analyze.spectral_reflectance(hsi, labeled_mask, n_labels=1, label=None)
returns reflectance plot
- Parameters:
- hsi - A hyperspectral datacube object, an instance of the
Spectral_dataclass (read in with pcv.readimage withmode='envi') - labeled_mask - Labeled mask of objects (32-bit).
- n_labels - Total number expected individual objects (default = 1).
- label - Optional label parameter, modifies the variable name of observations recorded. Can be a prefix or list (default = pcv.params.sample_label).
- hsi - A hyperspectral datacube object, an instance of the
- Example use:
- Below
- Output data stored: Data ('global_mean_reflectance', 'global_median_reflectance', 'global_spectral_std', 'wavelength_means', 'max_reflectance',
'min_reflectance', 'spectral_std', 'spectral_frequencies') automatically gets stored to the
Outputsclass when this function is ran. These data can always get accessed during a workflow (example below). For more detail about data output see Summary of Output Observations
from plantcv import plantcv as pcv
# Set global debug behavior to None (default), "print" (to file),
# or "plot" (Jupyter Notebooks or X11)
pcv.params.debug = "plot"
# Optionally, set a sample label name
pcv.params.sample_label = "spot"
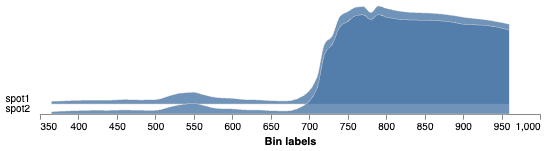
# Calculates reflectance values and saves the data as observations. Also provides a histogram of this data
spectral_hist = pcv.analyze.spectral_reflectance(hsi=spectral_data, labeled_mask=mask, n_labels=2)
Spectral Reflectance Intensity Histogram
Source Code: Here