Analyze the Spatial Distribution of Object(s)
Spatial distribution analysis outputs numeric properties describing the pixel distribution in the X or Y dimension for plants, roots, flowers, etc. In particular, this application can be useful for analyzing the distribution of roots in soil.
plantcv.analyze.distribution(labeled_mask, n_labels=1, direction="down", bin_size=100, hist_range="absolute", label=None)
returns Ridgeline plot of histograms of pixel distributions in the X or Y dimensions
- Parameters:
- labeled_mask - Labeled mask of objects from any binary mask or from
pcv.create_labels.- If given a binary image, function will return distribution of all pixels.
- n_labels - Optional parameter, total number expected individual objects (default = 1).
- direction - Optional parameter, image axis to calculate the distribution of object pixels ("down" or "across"; default = "down").
- bin_size - Optional parameter, defines the size of the bin in pixels in the X direction.
- hist_range - Optional parameter, the histogram range can be set to the image dimensions ("absolute") or "relative" to each object (default = "absolute").
- label - Optional label parameter, modifies the variable name of observations recorded. Can be a prefix or list (default = pcv.params.sample_label).
- labeled_mask - Labeled mask of objects from any binary mask or from
- Context:
- Used to output distribution of object(s) (labeled regions) in the X or Y dimensions of an image.
-
Example use:
-
Output data stored: Data ('x_frequencies', 'y_frequencies', 'x_distribution_mean', 'x_distribution_std', 'x_distribution_median', 'y_distribution_mean', 'y_distribution_std', 'y_distribution_median') automatically gets stored to the
Outputsclass when this function is ran. These data can always get accessed during a workflow (example below). For more detail about data output see Summary of Output Observations
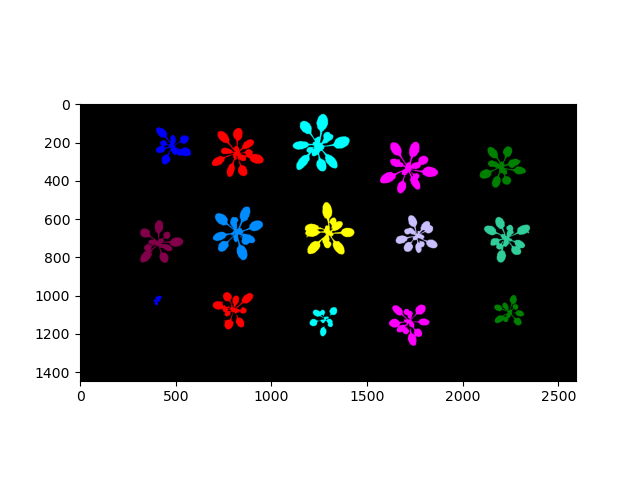
Labeled mask (colorized for effect)
from plantcv import plantcv as pcv
# Set global debug behavior to None (default), "print" (to file),
# or "plot" (Jupyter Notebooks or X11)
pcv.params.debug = "plot"
# Optionally, set a sample label name
pcv.params.sample_label = "plant"
# Calculate the distribution along the y-axis ("down")
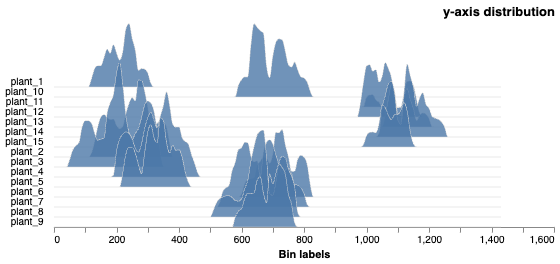
# The histogram scales are absolute, on the image coordinate scale
y_dist_chart = pcv.analyze.distribution(labeled_mask=mask, n_labels=num, bin_size=10)
# Access data stored out from analyze.distribution
y_distribution_mean = pcv.outputs.observations['plant_1']['y_distribution_mean']['value']
# Calculate the distribution along the y-axis ("down")
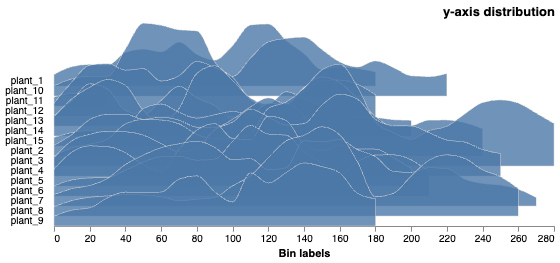
# The histogram scales are relative, on the object's coordinate scale
y_dist_chart = pcv.analyze.distribution(labeled_mask=mask, n_labels=num, bin_size=10, hist_range="relative")
Histograms of Y distribution values on the image scale
Histograms of Y distribution values on each object's scale
Source Code: Here