y_axis_pseudolandmarks
Divide plant object into twenty equidistant bins along the y-axis and assign pseudolandmark points based upon their actual (not scaled) position Once this data is scaled this approach may provide some information regarding shape independent of size
y_axis_pseudolandmarks(obj, mask, img, device, debug=None)
returns device, landmarks_on_leftside (left), landmarks_on_right (right), landmarks_at_center_along_the_horizontal_axis (center_h)
- Parameters:
- obj - A contour of the plant object (this should be output from the object_composition.py fxn)
- mask - This is a binary image. The object should be white and the background should be black
- img - A copy of the original image generated using np.copy if debug is true it will be drawn on
- device - Counter for image processing steps
- debug- None, "print", or "plot". Print = save to file, Plot = print to screen. Default = None
- Context:
- Used to identify a set of sixty equidistant landmarks on the vertical axis. Once scaled these can be used for shape analysis.
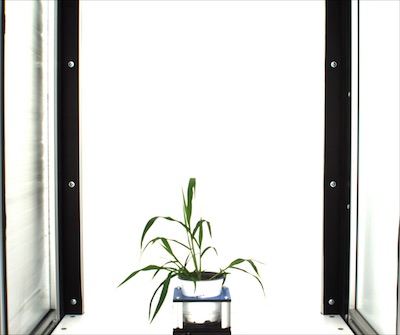
Input object contour and image
from plantcv import plantcv as pcv
device = 1
# Identify a set of land mark points
# Results in set of point values that may indicate tip points
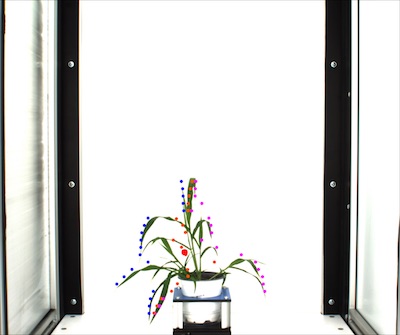
device, left, right, center_h = pcv.y_axis_pseudolandmarks(obj, mask, img, device, debug='print')
Image of points selected