class Params
A global PlantCV parameters class.
class plantcv.Params
Params is a class that stores global PlantCV attributes. An instance of Params is created on import automatically
as plantcv.params. Updated PlantCV functions import the plantcv.params instance to access globally
configured attributes.
Attributes
Attributes are accessed as plantcv.params.attribute.
device: A counter for image processing steps that is autoincremented by functions that use params. Default = 0.
debug: Debugging mode. Values are None, "print", or "plot". Default = None.
debug_outdir: The directory to output debug images to when plantcv.debug = "print".
line_thickness: The line thickness for plots created by plantcv.analyze.size, plantcv.analyze.bound_horizontal. plantcv.analyze.bound_vertical, plantcv.roi.filter, plantcv.homology.scale_features, plantcv.homology.x_axis_pseudolandmarks, plantcv.homology.y_axis_pseudolandmarks, plantcv.morphology.prune, plantcv.morphology.find_branch_pts, plantcv.morphology.check_cycles, plantcv.morphology.find_tips, plantcv.morphology.segment_skeleton, plantcv.morphology.segment_tangent_angle, plantcv.morphology.segment_id, and every region of interest function. Default = 5.
dpi: Dots per inch for plotting debugging images. Default = 100.
text_size: Size of the text for labels in debugging plots created by segment_angle, segment_curvature, segment_euclidean_length, segment_id, segment_insertion_angle, segment_path_length, and segment_tangent_angle from the morphology sub-package. Default = 0.55.
text_thickness: Thickness of the text for labels in debugging plots created by segment_angle, segment_curvature, segment_euclidean_length, segment_id, segment_insertion_angle, segment_path_length, and segment_tangent_angle from the morphology sub-package. Default = 2.
marker_size: Size of markers in debugging plots created by plantcv.transform.warp. Default = 60.
color_scale: The name of a color scale (a Matplot lib colormap) used by segment_angle, segment_curvature, segment_euclidean_length, segment_insertion_angle, segment_path_length, and segment_skeleton, segment_tangent_angle from the morphology sub-package, spatial_clustering, and watershed_segmentation from the base package. Default = "gist_rainbow". See the Matplotlib website for available options.
color_sequence: Set the sequence of colors from the color_scale created by the color_palette function to "sequential" or "random" order. Default = "sequential".
sample_label: Set the sample label (label) for all analyze functions. Default = "default".
saved_color_scale: Using the color_palette function will save the color scale here for reuse in downstream functions. Set to None to remove. Default = None.
verbose: Set the status of verboseness. When in "verbose" mode, the deprecation warning will always be printed once triggered. Default: True. Users can turn off deprecation warnings by setting verbose=False.
Example
Updated PlantCV functions use params implicitly, so overriding the params defaults will alter the behavior of
updated functions. In the meantime, it can also be used with older-style functions.
from plantcv import plantcv as pcv
# Set debug to plot instead of None
pcv.params.debug = "plot"
# Use a pre-v3 function to open an image
# Note that pcv.params.debug is passed to the debug argument
img, imgpath, imgname = pcv.readimage(filename="test.png")
# Use a v3 function to create a region of interest
# Note that debug is not explicitly provided but is used implicitly by the function
roi_contour, roi_hierarchy = pcv.roi.rectangle(x=100, y=100, h=200, w=200, img=img)
# It might be preferred to have a thicker or thinner line drawn depending on the size of the image.
# Change line thickness from the default (5) to make it thinner, and plot the rectangular ROI again,
# (note: this won't change the returns for most functions but instead is a purely optional preference regarding the plot in debug='print' and debug='plot')
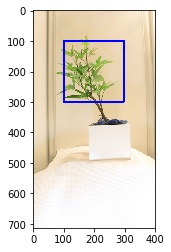
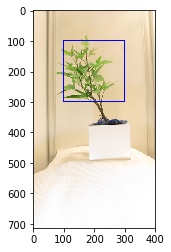
pcv.params.line_thickness = 3
roi_contour, roi_hierarchy = pcv.roi.rectangle(x=100, y=100, h=200, w=200, img=img)
Default Thickness (5)
pcv.params.line_thickness = 3
Source Code: Here