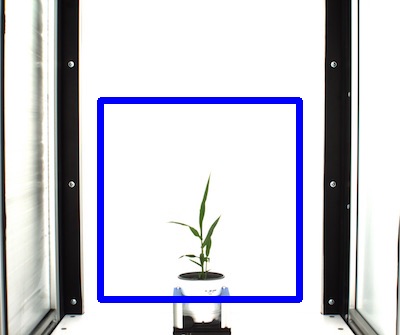
Create a rectangular Region of Interest (ROI)
plantcv.roi.rectangle(img, x, y, h, w)
returns roi
- Parameters:
- img - An RGB or grayscale image to plot the ROI on in debug mode.
- x - The x-coordinate of the upper left corner of the rectangle.
- y - The y-coordinate of the upper left corner of the rectangle.
- h - The height of the rectangle.
- w - The width of the rectangle.
- Context:
- Used to define a region of interest in the image.
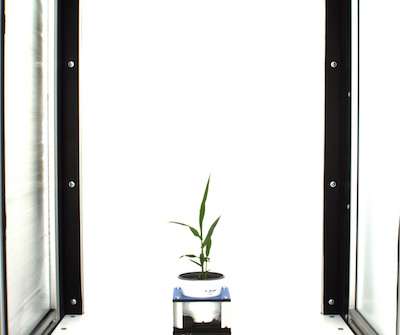
Reference Image
from plantcv import plantcv as pcv

# Set global debug behavior to None (default), "print" (to file),
# or "plot" (Jupyter Notebooks or X11)
pcv.params.debug = "plot"

roi = pcv.roi.rectangle(img=rgb_img, x=100, y=100, h=200, w=200)
Source Code: Here