Sobel Filter
This is a filtering method used to identify and highlight coarse changes in pixel intensity based on the 1st derivative. Similar results to the Scharr filter function.
plantcv.sobel_filter(gray_img, dx, dy, ksize)
returns filtered image
- Parameters:
- gray_img - Grayscale image data
- dx - derivative of x to analyze
- dy - derivative of y to analyze
- ksize - apertures size used to calculate 2nd derivative filter, specifies the size of the kernel (must be an odd integer)
- Context:
- Used to define edges within and around objects
- Aperture size must be greater than the largest derivative (
ksize >= dx & ksize >= dy) in order to run
- Example use:
- Below
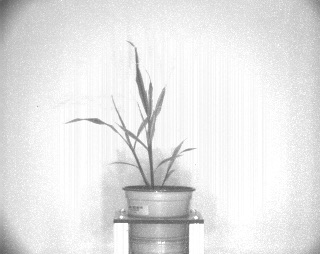
Original grayscale image
from plantcv import plantcv as pcv
# Set global debug behavior to None (default), "print" (to file),
# or "plot" (Jupyter Notebooks or X11)
pcv.params.debug = "plot"
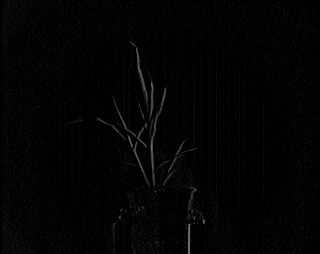
# Filtered image will highlight areas of coarse pixel
# intensity change based on 1st derivative
sb_x_img = pcv.sobel_filter(gray_img=gray_img, dx=1, dy=0, ksize=1)
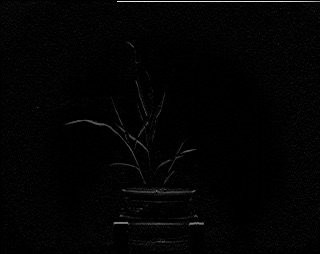
sb_y_img = pcv.sobel_filter(gray_img=gray_img, dx=0, dy=1, ksize=1)
Sobel filtered (x-axis)
Sobel filtered (y-axis)
Source Code: Here