Plot Histogram
This is a plotting method used to examine the distribution of signal within an image.
plantcv.visualize.histogram(img, mask=None, bins=None, lower_bound=None, upper_bound=None, title=None, hist_data=False)
returns fig_hist, hist_data
- Parameters:
- img - Image data which is numpy.ndarray, the original image for analysis.
- mask - Optional binary mask made from selected contours (default mask=None).
- bins - Number of class to divide spectrum into (default bins=100).
- lower_bound - lower bound of range to be shown in the histogram (default lower_range=None).
- upper_bound - upper bound of range to be shown in the histogram.
- title - The title for the histogram (default title=None)
- hist_data - Return histogram data if True (default hist_data=False)
Context: - Examine the distribution of the signal, this can help select a value for calling the binary thresholding function.
- Example use:
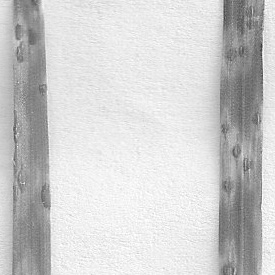
Grayscale image
Mask

from plantcv import plantcv as pcv
pcv.params.debug = "plot"
# Examine signal distribution within an image
# prints out an image histogram of signal within image
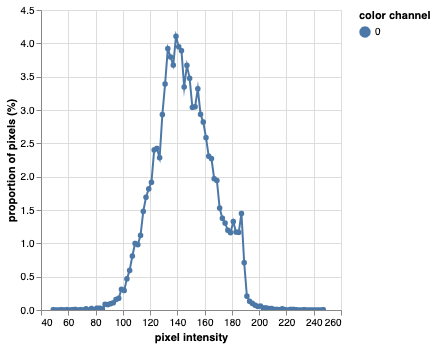
hist_figure1, hist_data1 = pcv.visualize.histogram(gray_img, mask=mask, hist_data=True)
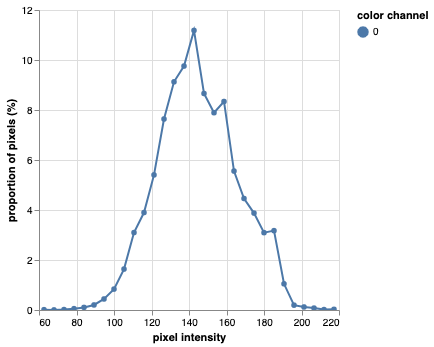
# Alternatively, users can change the `bins`, `lower_bound`, `upper_bound` and `title`.
hist_figure2, hist_data2 = pcv.visualize.histogram(img=gray_img, mask=mask, bins=30,
lower_bound=80, upper_bound=220,
title="Trimmed Histogram", hist_data=True)
Histogram of signal intensity
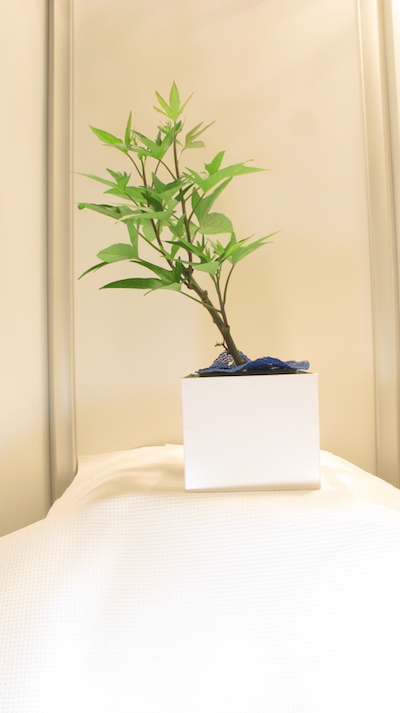
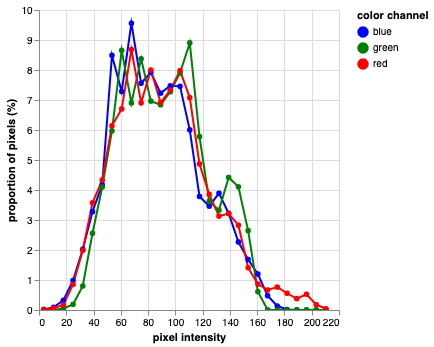
The histogram function plots histograms from 3 color bands automatically if an RGB input image is given.
RGB image
from plantcv import plantcv as pcv

pcv.params.debug = "plot"

# Examine signal distribution within an image
# prints out an image histogram of signal within image
hist_figure, hist_data = pcv.visualize.histogram(img=rgb_img, mask=mask, hist_data=True)
Source Code: Here