Scharr Filter
This is a filtering method used to identify and highlight gradient edges/features using the 1st derivative. Typically used to identify gradients along the x-axis (dx = 1, dy = 0) and y-axis (dx = 0, dy = 1) independently. Performance is quite similar to Sobel filter. Used to detect edges and/or changes in pixel intensity.
plantcv.scharr_filter(img, dx, dy, scale)
returns filtered image
- Parameters:
- img - RGB or grayscale image data
- dx - derivative of x to analyze (0 or 1)
- dy - derivative of y to analyze (0 or 1)
- scale - scaling factor applied (multiplied) to computed Scharr values (scale = 1 is unscaled)
- Context:
- This is a filtering method used to identify and highlight gradient edges/features using the 1st derivative. Typically used to identify gradients along the x-axis (dx = 1, dy = 0) and y-axis (dx = 0, dy = 1) independently. Performance is quite similar to Sobel filter.
- Derivatives must sum to 1 (
dx+dy == 1) in order to run
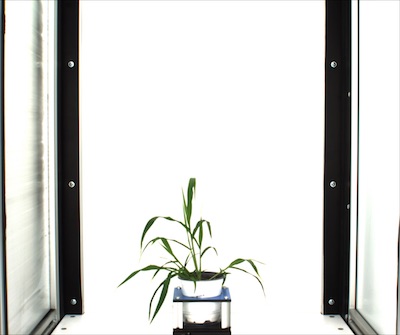
Original image
from plantcv import plantcv as pcv
# Set global debug behavior to None (default), "print" (to file),
# or "plot" (Jupyter Notebooks or X11)
pcv.params.debug = "plot"
# Apply to a grayscale image
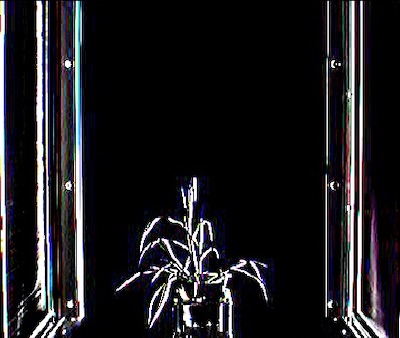
sr_x_img = pcv.scharr_filter(gray_img=gray_img, dx=1, dy=0, scale=1)
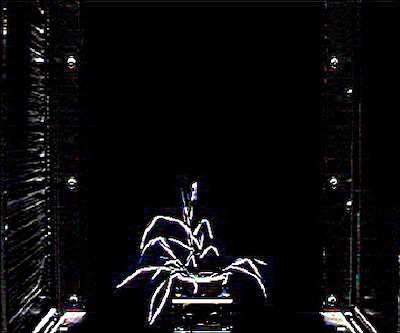
sr_y_img = pcv.scharr_filter(gray_img=gray_img, dx=0, dy=1, scale=1)
Scharr filtered (x-axis)
Scharr filtered (y-axis)
Source Code: Here