Interactive Point Annotation Tool
Using Jupyter Notebooks it is possible to interactively click to collect coordinates from an image, which can be used in various downstream applications. Left click on the image to collect a point. Right click removes the closest collected point.
plantcv.Points(img, figsize=(12, 6))
returns interactive image class
-
Parameters:
- img - Image data
- figsize - Interactive plot figure size (default = (12,6))
-
Attributes:
- points - Coordinates (x,y) of the collected points as a list of tuples
-
Context:
- Used to define a list of coordinates of interest.
- For example the
pcv.roi.customfunction defines a polygon Region of Interest based on a list of vertices, which can be labor intensive to define but is streamlined with the ability to click for point collection. - The list of vertices output has also shown to be helpful while using pcv.roi.multi in cases where centers are defined with a custom list of vertices.
- Example use:
- Below
from plantcv import plantcv as pcv

# Create an instance of the Points class
marker = pcv.Points(img=img, figsize=(12,6))

# Click on the plotted image to collect coordinates

# Use the identified coordinates to create a custom polygon ROI
roi1 = pcv.roi.custom(img=img, vertices=marker.points)
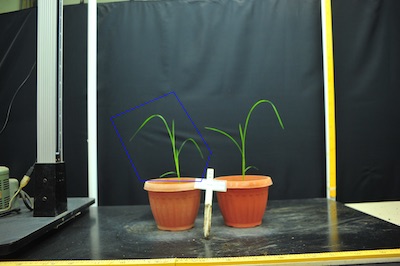
Selecting Coordinates
Resulting ROI
Source Code: Here