Analyze a Spectral Index
This function calculates the spectral index statistics and writes the values as observations out to the Outputs class.
plantcv.analyze.spectral_index(index_img, labeled_mask, n_labels=1, bins=100, min_bin=0, max_bin=1, label=None)
returns None
-
Parameters:
- index_img - instance of the
Spectral_dataclass (created by running pcv.spectral_index) - labeled_mask - Labeled mask of objects (32-bit).
- n_labels - Total number expected individual objects (default = 1).
- bins - Optional, number of bins to divide the index values into (default bins=100)
- min_bin - Optional, minimum bin label. Default of 0 will be used for the smallest bin label while calculating pixel frequency data unless otherwise defined.
min_bin="auto"will set minimum bin to the smallest observed pixel value within the masked index provided. - max_bin - Optional, maximum bin label. Default of 1 will be used for the maximum bin label unless otherwise defined.
max_bin="auto"will set maximum bin to the largest observed pixel value within the masked index provided. - label - Optional label parameter, modifies the variable name of observations recorded. Can be a prefix or list (default = pcv.params.sample_label).
- index_img - instance of the
-
Context:
- Calculates data about mean, median, and standard deviation of an input index within a masked region.
- If using an index that is expected to have negative values after masking (i.e. PRI) the default
min_bin=0will cut off pixel frequency data at 0 unless adjusted.
- Example use:
- Below
- Output data stored: Mean, median, and standard deviation of the index automatically gets stored to the
Outputsclass when this function is ran. These data can always get accessed during a workflow. For more detail about data output see Summary of Output Observations
from plantcv import plantcv as pcv

# Set global debug behavior to None (default), "print" (to file),
# or "plot" (Jupyter Notebooks or X11)

pcv.params.debug = "plot"
# Optionally, set a sample label name
pcv.params.sample_label = "plant"

pcv.analyze.spectral_index(index_img=ndvi_index, labeled_mask=mask,
                           min_bin=-1, max_bin=1)
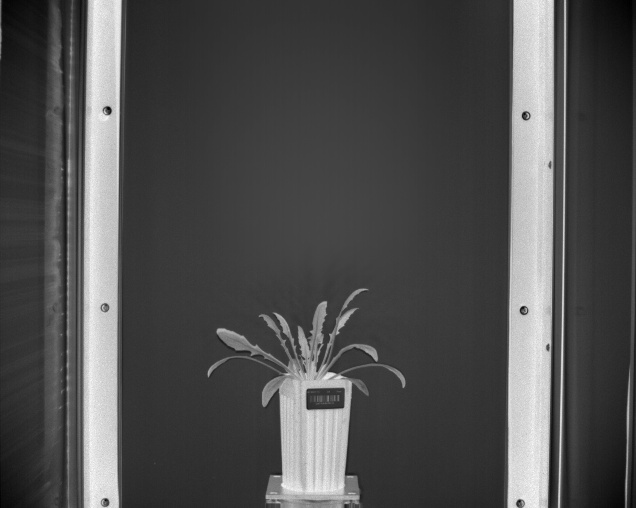
NDVI Index Image
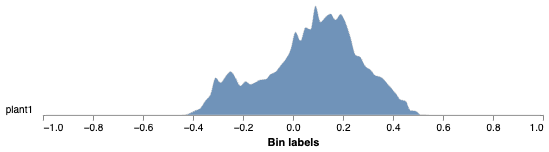
Masked Index Histogram
Source Code: Here