Homology: Starscape
Principal Component Analysis on pseudo-landmark data between two timepoints
plantcv.homology.starscape(cur_plms, group_a, group_b, outfile_prefix)
returns a dataframe of PCA results, a NumPy array of PC eigenvalues, and a dataframe of PC loadings
- Parameters:
- cur_plms - A pandas array of plm multivariate space representing capturing two adjacent frames in a time series or otherwise analogous dataset in order to enable homology assignments
- group_a - Name of group A (timepoint 1)
- group_b - Name of group B (timepoint 2)
- outfile_prefix - User defined file path and prefix name for PCA output graphics
- Context:
- Used to do Principal Component Analysis on pseudo-landmark data between two timepoints
- Example use:
from plantcv import plantcv as pcv
import pandas as pd

# Set global debug behavior to None (default), "print" (to file),
# or "plot" (Jupyter Notebooks or X11)

pcv.params.debug = "print"

final_df, eigenvals, loadings = pcv.homology.starscape(cur_plms=cur_plms, group_a="B100_rep1_d10",
                                                       group_b="B100_rep1_d11", outfile_prefix="./B100_d10_d11")

final_df.head()

#   plmname             filename        PC1         PC2         PC3
# 0 B100_rep1_d10_plm1  B100_rep1_d10   679.414040  -71.488066  -34.624416
# 1 B100_rep1_d10_plm2  B100_rep1_d10   -62.215929  -55.052674  153.806037
# 2 B100_rep1_d10_plm3  B100_rep1_d10   14.256346   475.918362  -30.316153
# 3 B100_rep1_d10_plm4  B100_rep1_d10   -237.327344 -127.302125 38.876346
# 4 B100_rep1_d10_plm5  B100_rep1_d10   -274.667223 120.381513  -126.398386
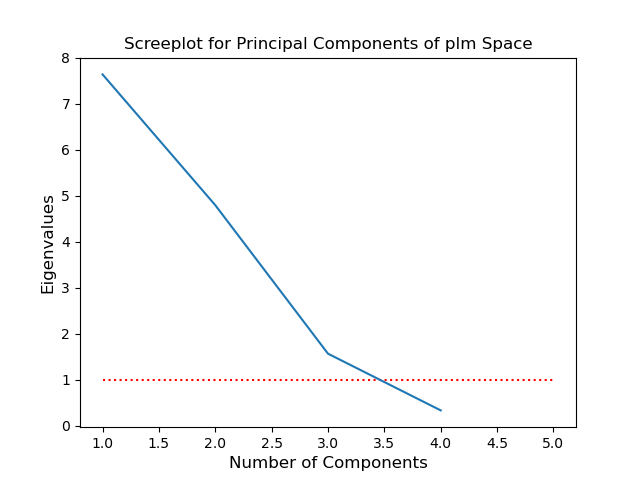
Screeplot
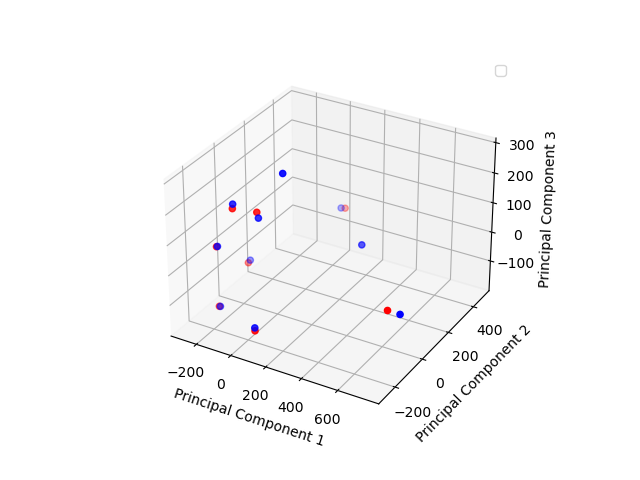
Principal Components 1-3
Source Code: Here