Create Multiple Regions of Interest (ROI)
plantcv.roi.multi(img, coord, radius=None, spacing=None, nrows=None, ncols=None)
returns roi_objects
- Parameters:
- img = Input image data.
- coord = Two-element tuple of the center of the top left object.
- radius = Optional parameter to specify the radius of the ROIs.
- spacing = Two-element tuple of the horizontal and vertical spacing between ROIs.
- nrows = Number of rows in ROI layout.
- ncols = Number of columns in ROI layout.
- Context:
- Used to define multiple regions of interest in the same image. Users can either specify a
starting coordinate (
coord), number of row and columns, and spacing to create a grid of ROIs, or a custom list of coordinates that specify the centers of the ROIs. Providing a custom list of coordinates (list of tuples) is useful for missing plants or any arrangement that isn't a perfect grid. Returns an Objects instance that can be used in downstream steps. The analysis image includes a number representing ROI order.
- Used to define multiple regions of interest in the same image. Users can either specify a
starting coordinate (
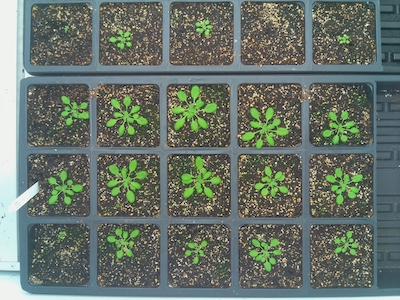
Reference Image
from plantcv import plantcv as pcv
# Set global debug behavior to None (default), "print" (to file),
# or "plot" (Jupyter Notebooks or X11)
pcv.params.debug = "plot"
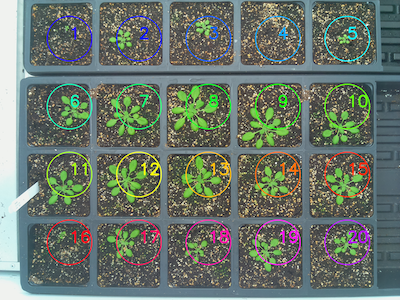
# Make a grid of ROIs
rois1 = pcv.roi.multi(img=img1, coord=(25,120), radius=20,
spacing=(70, 70), nrows=3, ncols=6)
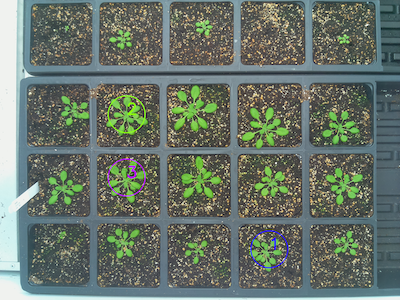
# Specify a list of coordinates of desired ROIs
rois2 = pcv.roi.multi(img=img1, coord=[(1745,1615), (820, 740), (820,1150)], radius=20)
Grid of ROIs
Custom list of ROIs
Next steps:
This function returns an Objects dataclass, which can be used with create_labels to create a labeled mask for use with analysis functions.
lbl_mask, n_lbls = pcv.create_labels(mask=mask, rois=rois)
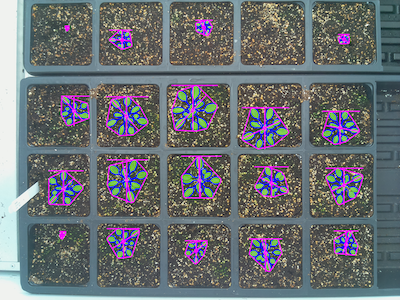
# Analyze the shape of each plant
shape_img = pcv.analyze.size(img=img1, labeled_mask=lbl_mask, n_labels=n_lbls, label="plant")
# Print out a text file with shape data for each plant in the image
pcv.outputs.save_results(filename=filename)
Image with shape analysis characteristics on each plant
Source Code: Here