Pseudocolor Grayscale Image
This function pseudocolors any grayscale image to a custom colormap. An optional mask can leave background out in the
pseudocolored image. Additionally, optional maximum and minimum values can be specified. When pcv.params.debug='print'
then the image gets saved to pcv.params.debug_outdir, andpcv.params.dpi can be set for the image that gets saved. If
unaltered, the matplotlib default DPI is 100 pixels per inch.
plantcv.visualize.pseudocolor(gray_img, mask=None, background="image", cmap=None, min_value=0, max_value=255, axes=True, colorbar=True, bad_mask=None, bad_color="red")
returns pseudocolored image (that can be saved with pcv.print_image)
-
Parameters:
- gray_img - Grayscale image data
- mask - Binary mask made from selected contours (optional)
- cmap - Custom colormap, see here for tips on how to choose a colormap in Matplotlib.
- background - Background color/type. Options are "image" (default), "white", or "black". A mask must be supplied in order to utilize this parameter.
- min_value - Minimum value (optional) for range of the colorbar. Default: 0
- max_value - Maximum value (optional) for range of the colorbar. Default: 255
- axes - If False then the title, x-axis, and y-axis won't be displayed (default axes=True).
- colorbar - If False then the colorbar won't be displayed (default colorbar=True)
- title - The title for the pseudocolored image (default title=None)
- bad_mask - binary mask of pixels with "bad" values, e.g. nan or inf or any other values considered to be not informative and should be excluded from analysis. default = None
- bad_color - The color that shows "bad" pixels in output pseudocolored image, default: "red"
-
Context:
- Used to pseudocolor any grayscale image to custom colormap
- Example use:
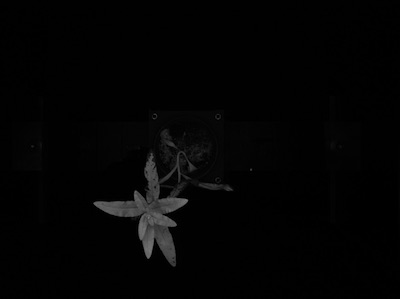
Original grayscale image
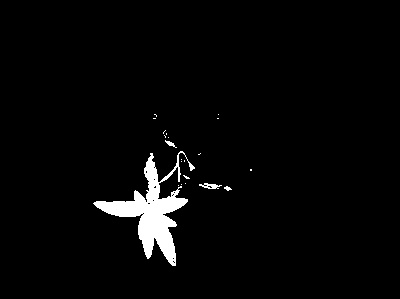
Mask
Mask of "bad" values

from plantcv import plantcv as pcv
pcv.params.debug='plot'
# Pseudocolor an image with 'viridis' colormap
pseudo_img = pcv.visualize.pseudocolor(gray_img=img, mask=None, cmap='viridis',
min_value=0, max_value=255)
# Pseudocolor the same image but include the mask and limit the range of values
pseudo_img_masked = pcv.visualize.pseudocolor(gray_img=img, mask=mask,
background="white", cmap='viridis',
min_value=30, max_value=200)
# Save the masked and pseudocolored image
pcv.print_image(pseudo_img_masked, 'nir_tv_z300_L1_pseudocolored.png')
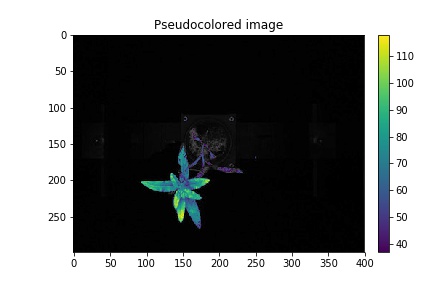
# Pseudocolor the masked area and plot on the grayscale background
pseudo_img_on_input = pcv.visualize.pseudocolor(gray_img=img, mask=mask,
background="image", cmap="viridis")
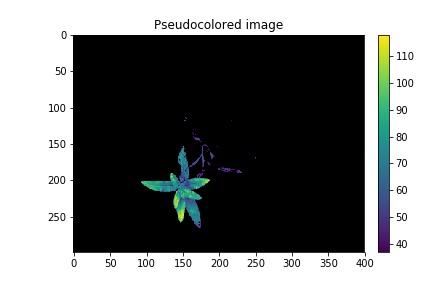
# Use a black background instead
pseudo_img_black_bkgd = pcv.visualize.pseudocolor(gray_img=img, mask=mask,
background="black", cmap='viridis')
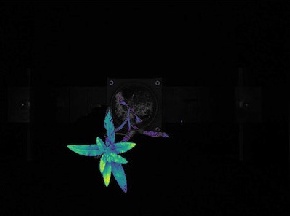
simple_pseudo_img = pcv.visualize.pseudocolor(gray_img=img, mask=mask,
background="image", axes=False,
colorbar=False, cmap='viridis')
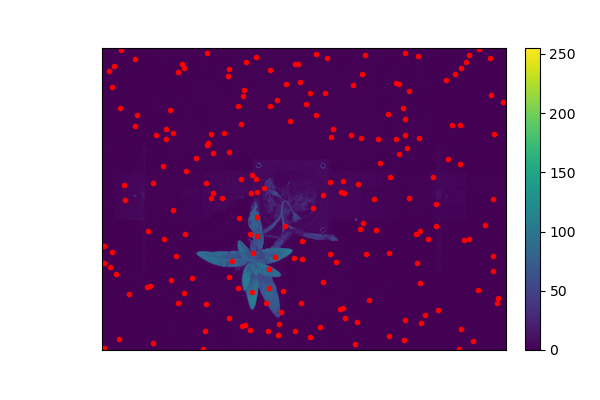
# When there are some user defined "bad" pixels indicated in array "bad_mask", and the red color is used to visualize them in the visualization.
pseudo_img_bad_mask = pcv.visualize.pseudocolor(gray_img=img, mask=None, bad_mask=bad_mask, bad_color="red", axes=False, colorbar=False)
# When there are some user defined "bad" pixels indicated in array "bad_mask", and the red color is used to visualize them in the visualization.
pseudo_img_mask_obj_bad_mask = pcv.visualize.pseudocolor(gray_img=img, obj=obg, mask=mask, background="white", bad_mask=bad_mask, bad_color="red", axes=False, colorbar=True)
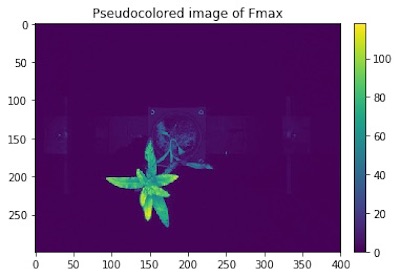
Pseudocolored Image
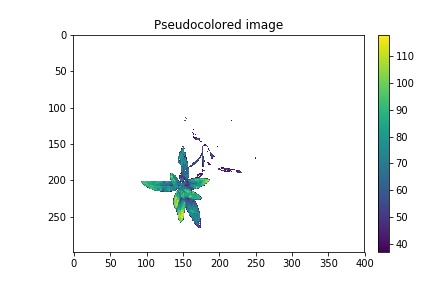
Pseudocolored, background="white"
Pseudocolored, background="image"
Pseudocolored, background="black"
Pseudocolored, Plotted on Input Image (no axes or colorbar)
Pseudocolored, Pixels With User Defined "bad" Values Marked Using Red Color (no axes or colorbar)
Source Code: Here