Plot Histograms for Hyperspectral Images
This is a plotting method that is used to examine the distribution of signal within an hyperspectral image for specific wavelengths. This function is an application of the histogram function.
plantcv.visualize.hyper_histogram(hsi, mask=None, bins=100, lower_bound=None, upper_bound=None, title=None, wvlengths=[480, 550, 670])
returns fig_hist
-
Parameters:
- hsi - Spectral_data
- mask - Optional binary mask made from selected contours.
- bins - Number of class to divide spectrum into (default bins=100).
- lower_bound - Lower bound of range to be shown in the histogram (default lower_range=None).
- upper_bound - Upper bound of range to be shown in the histogram.
- title - The title for the histogram (default title=None)
- wvlengths - Interested wavelengths (in nanometers) to show histogram of (default wvlengths=[480, 550, 670])
-
Context:
- Examine the distribution of the signal, this can help select a value for calling the binary thresholding function.
- If the provided wavelength is in the range of visible spectrum, the color corresponds to the wavelength would be used as the histogram color
-
Example use:
Hyperspectral image
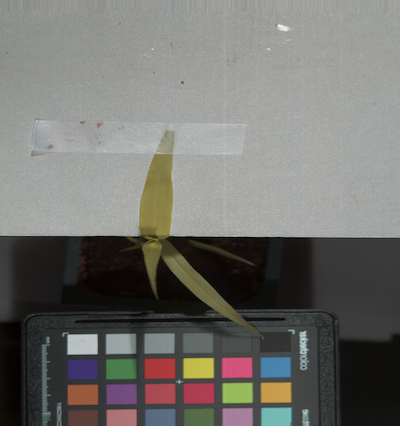
Mask

from plantcv import plantcv as pcv
pcv.params.debug = "plot"
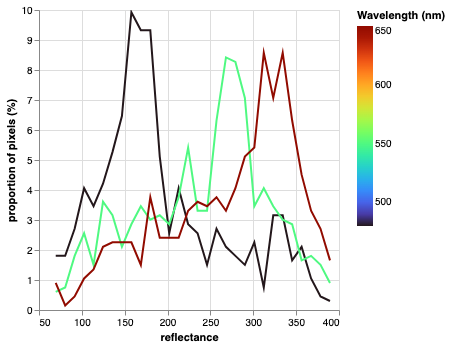
# Showing histograms for 3 default wavelengths
hist_figure1 = pcv.visualize.hyper_histogram(hsi=hsi, mask=mask)
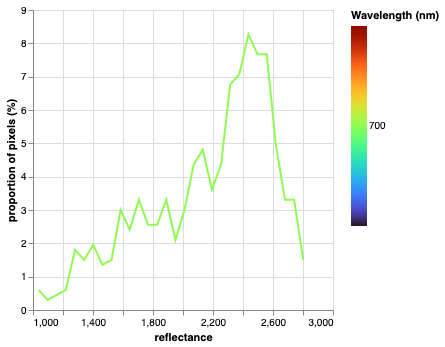
# Showing the histogram for a single wavelength (700nm)
hist_figure2 = pcv.visualize.hyper_histogram(hsi=hsi, mask=mask, wvlengths=[700])
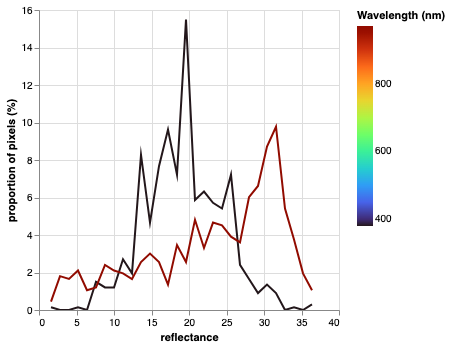
# Showing the histogram for two wavelengths
hist_figure3 = pcv.visualize.hyper_histogram(hsi=hsi, mask=mask, wvlengths=[380, 970])
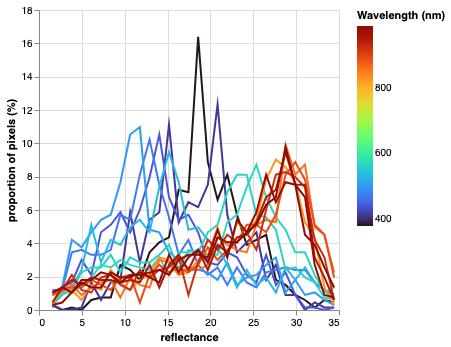
# Showing the histogram for multiple wavelengths
hist_figure4 = pcv.visualize.hyper_histogram(hsi=hsi, mask=mask,
wvlengths=[379, 409, 439, 469, 499, 529, 559, 568,
829, 859, 889, 919, 949, 979, 987])
Histogram of signal intensity
To plot all wavelengths (not recommended for hyperspectral images supporting a large number of bands):
# Plot not shown
hist_all_wv = pcv.visualize.hyper_histogram(hsi=hsi, mask=mask, wvlengths=list(hsi.wavelength_dict.keys()))
Source Code: Here