Horizontal Boundary Line Tool
Set boundary line with boundary tool, this allows the user to find the extent-y ('height') above and below as well as the area above and below the boundary line. This tool functions best if the pot size/position of the plant remains relatively constant.
plantcv.analyze.bound_horizontal(img, labeled_mask, line_position, n_labels=1, label=None)
returns image with boundary data
- Parameters:
- img - RGB or grayscale image data for plotting
- labeled_mask - Labeled mask of objects (32-bit).
- line_position - position of boundary line (a value of 0 would draw the line through the top of the image)
- n_labels - Total number expected individual objects (default = 1).
- label - Optional label parameter, modifies the variable name of observations recorded. Can be a prefix or list (default = pcv.params.sample_label).
- Context:
- Used to define a boundary line for the image, to find the height above and below as well as area above and below a boundary line.
- Example use:
- Output data stored: Data ('horizontal_reference_position', 'height_above_reference', 'height_below_reference',
'area_above_reference', 'percent_area_above_reference', 'area_below_reference', 'percent_area_below_reference') automatically
gets stored to the
Outputsclass when this function is ran. These data can always get accessed during a workflow (example below). For more detail about data output see Summary of Output Observations
from plantcv import plantcv as pcv

# Set global debug behavior to None (default), "print" (to file),
# or "plot" (Jupyter Notebooks or X11)
pcv.params.debug = "plot"
# Optionally, set a sample label name
pcv.params.sample_label = "plant"

# Set Boundary Line
boundary_image = pcv.analyze.bound_horizontal(img=img, labeled_mask=bin_mask, line_position=300, n_labels=1)

# Access data stored out from analyze_bound_horizontal
percent_area_below_reference = pcv.outputs.observations['plant_1']['percent_area_below_reference']['value']
Boundary tool output image (y = 300)
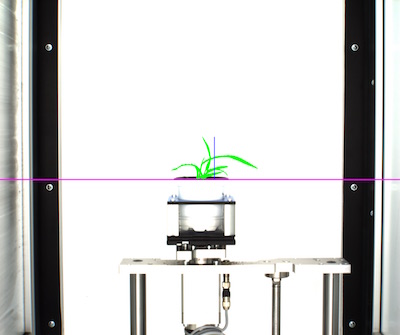
Boundary line set at 300, purple line is boundary line, blue line is height above boundary line, green is area above boundary line.
Boundary tool output image (y = 520)
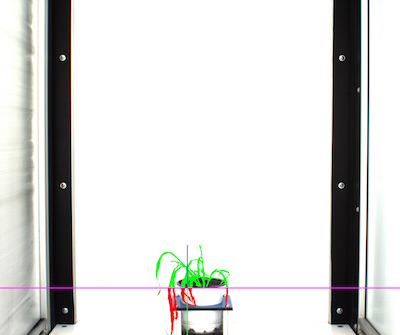
Boundary line set at 520, purple is boundary line, blue line is height above boundary line, green line is height below boundary line, green is area above boundary line and red is area below boundary line.
Source Code: Here