Read CropReporter Fluorescence Image Files
Reads .INF/.DAT image data from a PhenoVation CropReporter system into a PSII_data instance containing xarray DataArrays with labeled frames.
plantcv.photosynthesis.read_cropreporter(filename)
returns ps
-
Parameters:
- filename - INF metadata file to be read (possibly including a path). DAT files are automatically detected.
-
Context:
- Reads in binary image files to be processed and does so using the metadata contained within a corresponding .INF file.
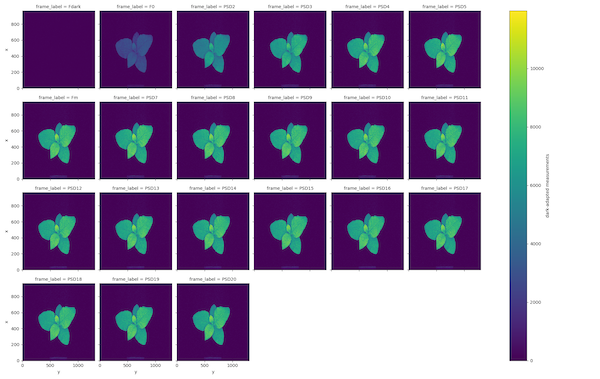
- Measurements from dark-adapted plant state are stored in the attribute
ojip_darkorpam_dark, depending on the measurement protocol. Frames F0 and Fm are labeled according to the metadata in .INF. The default measurement label is 't0'. - Measurements from light-adapted plant state are stored in the attribute
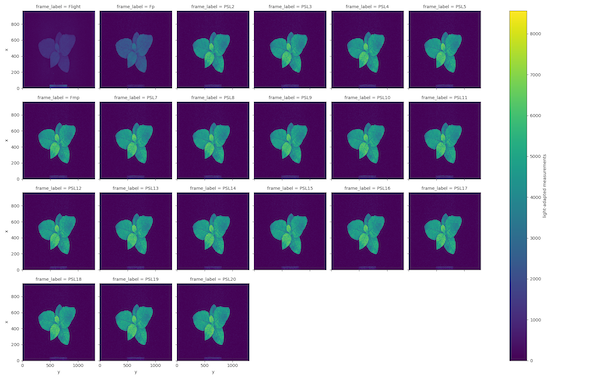
ojip_lightorpam_light, depending on the measurement protocol. Frames Fp and Fmp are labeled according to the metadata in .INF. The default measurement label is 't1'. - Measurements from chlorophyll fluorescence are stored in the attribute
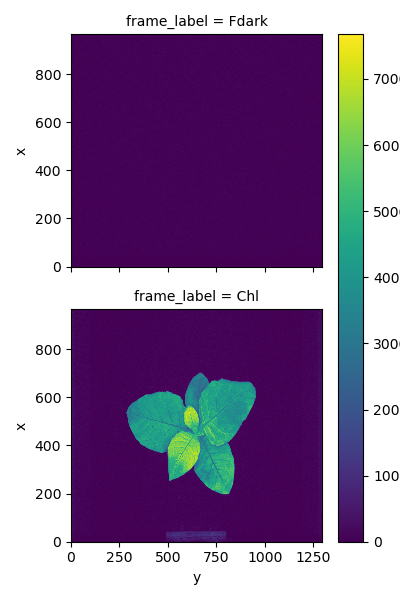
chlorophylland include a dark frame (Fdark) and chlorophyll fluorescence frame (Chl). - Spectral measurements are stored as a PlantCV Spectral_data object in the attribute
spectral. Frames are stored by reflectance wavelength and can include: blue (475nm), green (550nm), red (640nm), green2 (540nm), far-red (710nm), and near-infrared (770nm).
- Example use:
Note
This function assumes a specific pattern between the .INF metadata file and the corresponding .DAT binary image
filenames. We assume that for metadata file HDR_xx.INF or xx_HDR_xx.INF there will be a corresponding image files with the same path, containing XXX_xxx.DAT or xx_XXX_xxx.DAT where XXX is the analysis protocol (e.g. PSD, PSL, etc.). Some CropReporter imaging protocols will results in multiple binary image .DAT files per .INF metadata file.
from plantcv import plantcv as pcv

# Set global debug behavior to None (default), "print" (to file),
# or "plot" (Jupyter Notebooks or X11)
pcv.params.debug = "plot"

#read in image
ps = pcv.photosynthesis.read_cropreporter(filename="PSII_HDR_020321_WT_TOP_1.INF")

# you can check which variables were imported at the prompt with:
ps

# to see the frames you imported use xarray plot methods e.g.
ps.ojip_dark.plot(col='frame_label', col_wrap=4)
OJIP Dark-adapted fluorescence measurements
OJIP Light-adapted fluorescence measurements
Chlorophyll fluorescence measurements
Spectral reflectance measurements
Source Code: Here