Analyze Nonphotochemical Quenching of Photosystem II
Extract estimates of the nonphotochemical quenching (NPQ) of Photosystem II (PSII). Calculates (Fm/Fm') - 1 data from a masked region. The photosynthesis subpackage is dependent on a PSII_Data instance file structure as created by photosynthesis.read_* files.
plantcv.analyze.npq(ps_da_light, ps_da_dark, labeled_mask, n_labels=1, auto_fm=False, min_bin=0, max_bin="auto", measurement_labels=None, label=None)
returns NPQ DataArray and Histograms of NPQ values
- Parameters:
- ps_da_light - photosynthesis xarray DataArray for which to compute npq
- ps_da_dark - photosynthesis xarray DataArray that contains frame_label
Fm - labeled_mask - Labeled mask of objects (32-bit).
- n_labels - Total number expected individual objects (default = 1).
- auto_fm - Automatically calculate the frame with maximum fluorescence per label, otherwise use a fixed frame for all labels (default = False).
- min_bin - minimum bin value ("auto" or user input minimum value - must be an integer). (default
min_bin=0) - max_bin - maximum bin value ("auto" or user input maximum value - must be an integer). (default
max_bin="auto") - measurement_labels - list of label(s) for each measurement in
ps_da_light, modifies the variable name of observations recorded - label - Optional label parameter, modifies the variable name of observations recorded. Can be a prefix or list (default = pcv.params.sample_label).
- Context:
- Used to extract NPQ per identified plant pixel.
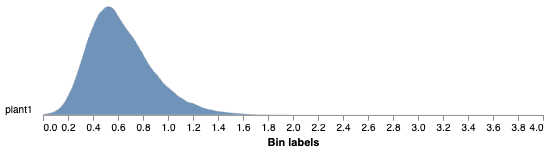
- Generates histogram of NPQ values.
- Generates an NPQ image.
- Example use:
- Output data stored: Data ('npq_hist_{measurement_label}', 'npq_max_{measurement_label}', 'npq_median_{measurement_label}') are automatically stored to the
Outputsclass when this function is run. These data can be accessed during a workflow (example below).{measurement_label}is automatically created when importing the dataset, e.g. withread_cropreporter()but can be overwritten withmeasurement_labelsargument. Summary of Output Observations
from plantcv import plantcv as pcv

# Set global debug behavior to None (default), "print" (to file),
# or "plot" (Jupyter Notebooks or X11)
pcv.params.debug = "plot"
# Optionally, set a sample label name
pcv.params.sample_label = "plant"

# Analyze NPQ
npq, npq_hist = pcv.analyze.npq(ps_da_light=ps.ojip_light, ps_da_dark=ps.ojip_dark, labeled_mask=kept_mask)

# Access the NPQ median value
# the default measurement label for cropreporter data is t1
npq_median = pcv.outputs.observations['plant_1']['npq_median_t1']['value']

# Pseudocolor the NPQ image
pseudo_img = pcv.visualize.pseudocolor(gray_img=npq, mask=kept_mask, min_value=0, max_value=1, title="NPQ")
Histogram of NPQ values
Pseudocolored output image based on NPQ
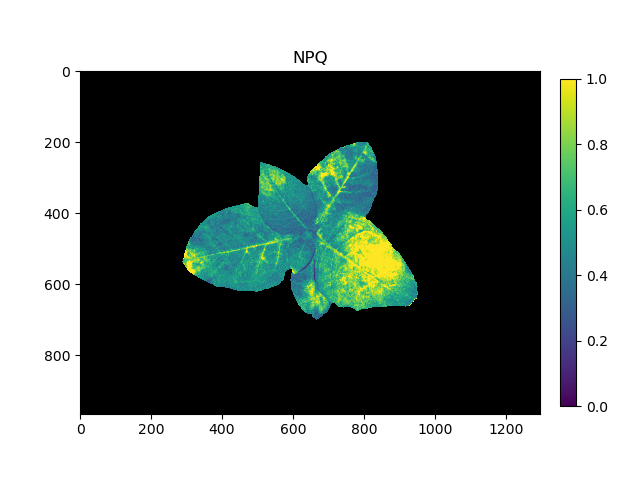
The grayscale NPQ image can be used with the pcv.visualize.pseudocolor function which allows the user to pick a colormap for plotting.
Source Code: Here