Homology: Acute
Identify landmark positions within a contour for morphometric analysis
plantcv.homology.acute(img, mask, win, threshold)
returns
homolog_pts = pseudo-landmarks selected from each landmark cluster
start_pts = pseudo-landmark island starting position; useful in parsing homolog_pts in downstream analyses
stop_pts = pseudo-landmark island end position ; useful in parsing homolog_pts in downstream analyses
ptvals = average values of pixel intensity from the mask used to generate cont; useful in parsing homolog_pts in downstream analyses
chain = raw angle scores for entire contour, used to visualize landmark clusters
verbose = supplemental file which stores coordinates, distance from landmark cluster edges, and angle score for entire contour. Used in troubleshooting.
- Parameters:
- img - The original image, used for plotting purposes
- mask - Binary mask used to generate contour array (necessary for ptvals)
- win - The maximum cumulative pixel distance window for calculating angle score; 1 cm in pixels often works well
- thresh - Angle score threshold to be applied for mapping out landmark coordinate clusters within each contour
- Context:
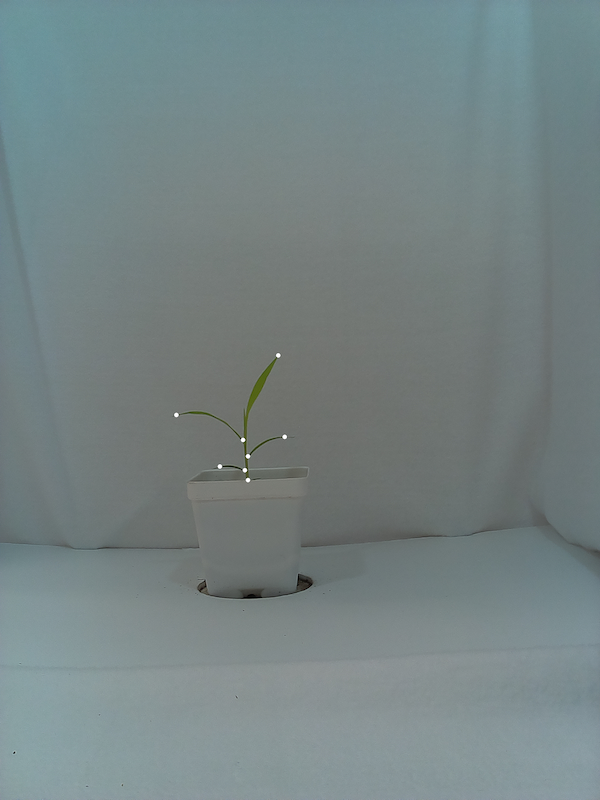
- Used to identify pseudo-landmark positions along the contour of a plant for morphometric analysis
- Example use:
Original image
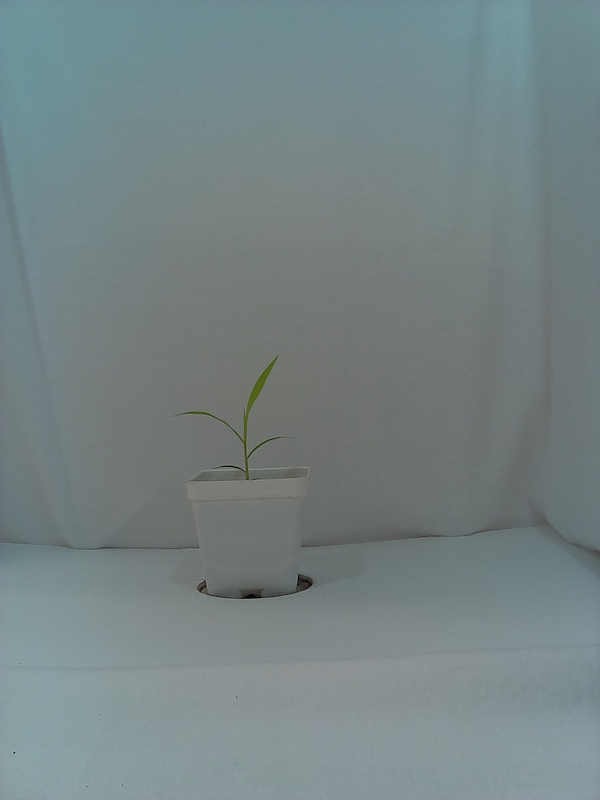
Image mask

from plantcv import plantcv as pcv

# Set global debug behavior to None (default), "print" (to file),
# or "plot" (Jupyter Notebooks or X11)

pcv.params.debug = "plot"

# Given an image, mask, and object contours, identify pseudo-landmarks with acute

homolog_pts, start_pts, stop_pts, ptvals, chain, max_dist = pcv.homology.acute(img=img, mask=mask, win=25, threshold=90)
Pseudo-landmark points
Source Code: Here