Create a Grid of Circular Regions of Interest (ROI) Automatically
plantcv.roi.auto_grid(mask, nrows, ncols, radius=None, img=None)
returns roi_objects
- Parameters:
- mask = A binary mask.
- nrows = Number of rows in ROI layout.
- ncols = Number of columns in ROI layout.
- radius = Optional parameter to specify the radius of the ROIs.
- img = Optional Image from which the binary mask was created.
- Context:
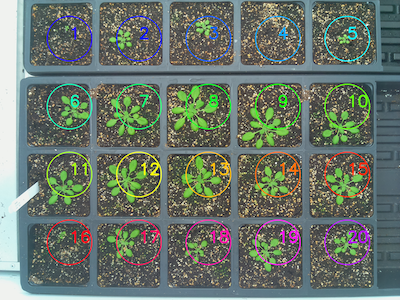
- Used to define a grid of multiple circular regions of interest in the same binary mask. Users specify a number of rows and columns, and the function detects a grid of circular ROIs based on the inputs. A custom radius can optionally be set for the individual circles. If the image from which the binary mask was created is passed as an argumnet, ROIs will be drawn on that image if debug is set to plot. Otherwise, they will be drawn on the binary mask. Returns an Objects dataclass that can be used in downstream steps. It is not necessary for there to be a plant in every grid cell, just that the objects follow a general grid structure and that there is at least one object in each row and column. Similar to the pcv.roi.multi function.
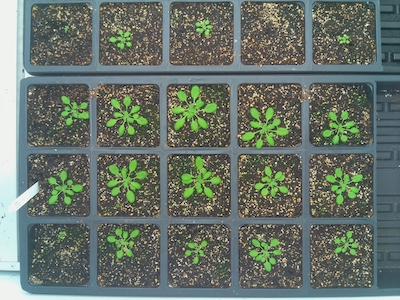
Reference Image

from plantcv import plantcv as pcv

# Set global debug behavior to None (default), "print" (to file),
# or "plot" (Jupyter Notebooks or X11)
pcv.params.debug = "print"

# Make a grid of ROIs
rois = pcv.roi.auto_grid(mask=mask, nrows=3, ncols=6, radius=20, img=img)
Grid of ROIs

Next steps:
This function returns an Objects dataclass, which can be used with create_labels to createa a labeled mask for use with analysis functions.
lbl_mask, n_lbls = pcv.create_labels(mask=mask, rois=rois)

# Analyze the shape of each plant
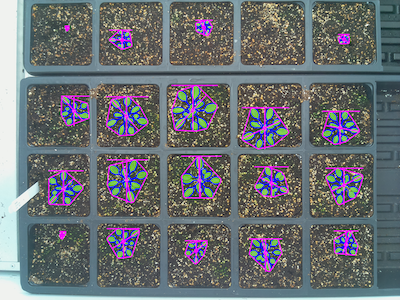
shape_img = pcv.analyze.size(img=img_copy, labeled_mask=lbl_mask, n_labels=n_lbls, label="plant")

# Print out a text file with shape data for each plant in the image
pcv.outputs.save_results(filename=filename)
Image with shape analysis characteristics on each plant

Source Code: Here