Analyze Temperatures
This function calculates the temperature of each pixel and stores summary statistics and the distribution of temperature values.
plantcv.analyze.thermal(thermal_img, labeled_mask, n_labels=1, bins=100, label=None)
returns temperature histogram
- Parameters:
- thermal_img - Numpy array of thermal image data (most likely read in with pcv.readimage with
mode='csv') - labeled_mask - Labeled mask of objects (32-bit, output from
pcv.create_labelsorpcv.roi.filter). - n_labels - Total number expected individual objects (default = 1).
- bins - Number of histogram bins (default = 100)
- label - Optional label parameter, modifies the variable name of observations recorded. Can be a prefix or list (default = pcv.params.sample_label).
- thermal_img - Numpy array of thermal image data (most likely read in with pcv.readimage with
- Context:
- Data about image temperature within a masked region.
- Example use:

- Below
- Output data stored: Data ('max_temp', 'min_temp', 'mean_temp', 'median_temp', 'thermal_frequencies') automatically gets stored to the
Outputsclass when this function is ran. These data can always get accessed during a workflow (example below). For more detail about data output see Summary of Output Observations
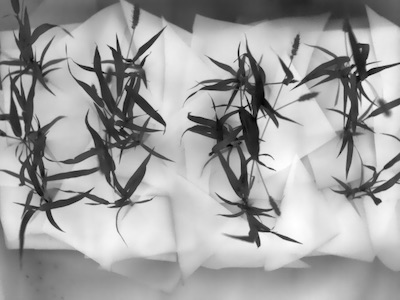
Original thermal array image
from plantcv import plantcv as pcv
# Set global debug behavior to None (default), "print" (to file),
# or "plot" (Jupyter Notebooks or X11)
pcv.params.debug = "plot"
# Optionally, set a sample label name
pcv.params.sample_label = "plant"
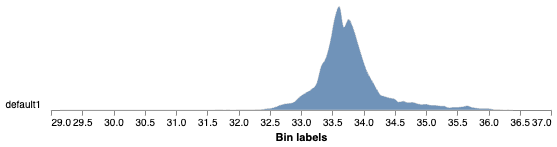
# Caclulates the proportion of pixels that fall into a signal bin and writes the values to a file. Also provides a histogram of this data
thermal_hist = pcv.analyze.thermal(thermal_img=thermal_img, labeled_mask=mask)
# Access data stored out from analyze.thermal
temp_range = pcv.outputs.observations['plant_1']['max_temp']['value'] - pcv.outputs.observations['plant_1']['min_temp']['value']
Thermal Frequency histogram
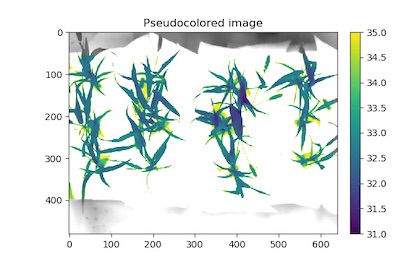
Note
A grayscale input image and object mask can be used with the pcv.visualize.pseudocolor function which allows the user to pick a colormap for plotting.
# Pseudocolor the thermal
pseudocolor_img  = pcv.visualize.pseudocolor(thermal_img, min_value=31, max_value=35, mask=mask)
Source Code: Here