Plot chlorophyll fluorescence induction curves
Creates a chart of chlorophyll fluorescence induction curves from a PSII_Data instance. The photosynthesis subpackage is
dependent on a PSII_Data instance file structure as created by photosynthesis.read_cropreporter. Plots the mean level
of fluorescence per object/label per frame/timepoint. The PSII_Data Fm and Fm' frames are labeled and the chart can be used
to decide whether to use auto_fm in pcv.analyze.yii and pcv.analyze.npq.
plantcv.visualize.chlorophyll_fluorescence(ps_da, labeled_mask, n_labels=1, label="object")
returns chlorophyll fluorescence induction curve chart
- Parameters:
- ps_da - photosynthesis xarray DataArray ("ojip_light" or "ojip_dark")
- labeled_mask - Labeled mask of objects (32-bit).
- n_labels - Total number expected individual objects (default = 1).
- label - optional label parameter, modifies the prefix of the group plotting label
- Context:
- Used to visualize chlorophyll florescence induction curves.
- Example use:
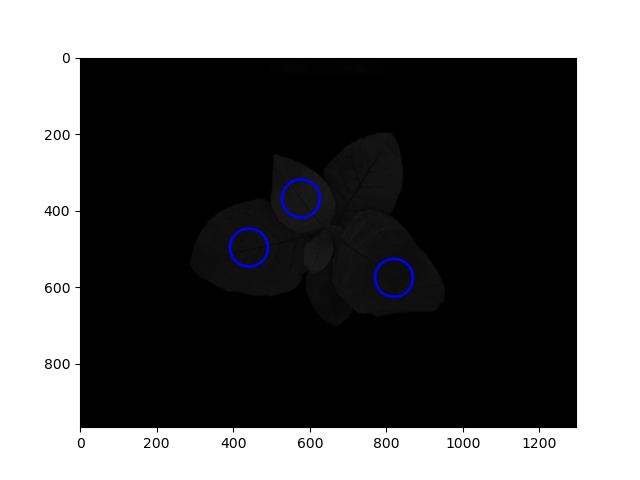
Example image with labels marking three leaves
from plantcv import plantcv as pcv
# Set global debug behavior to None (default), "print" (to file),
# or "plot" (Jupyter Notebooks or X11)
pcv.params.debug = "plot"
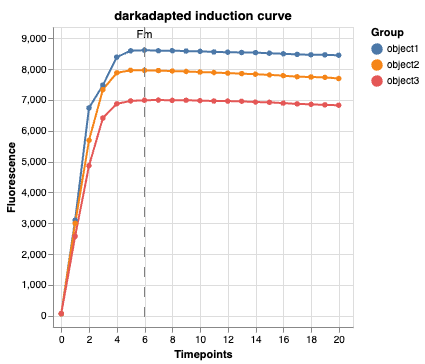
chart = pcv.visualize.chlorophyll_fluorescence(ps_da=ps.ojip_dark, labeled_mask=labeled_mask, n_labels=3, label="object")
Chlorophyll fluorescence induction curve chart
Source Code: Here